USD Fundamentals: Greenback Tumbles After ISM Services PMI Drops Below “Recessionary” 50 Level
The Friday Fx market action has confused many traders. The US dollar finally had a good week, having risen versus most currency peers well into late Friday trading. Then (at 4 pm CET, 10 am ET), the ISM services PMI index was released, printing a massive negative surprise of 49.6 against consensus expectations of 55.00.
This mattered hugely for the Fx market because the ISM PMI reports are the leading indicators for US GDP and growth. Readings below 50.00 indicate economic contraction (recession). In addition to the massive 5.4 points miss of expectations, this was the first ISM services print below 50 since the Covid crisis in 2020.
This is why the dollar plunged so hard on Friday and is extending the decline into the new week. Even the Nonfarm payrolls report (which was healthy overall) didn’t matter much to investors. The market is continuing to fuel the “Fed pivot” narrative, and this latest ISM services report miss only added fuel to the fire. The market is behaving like a recession is already here, and a Fed shift from hiking to cutting rates is imminent. As long as the sentiment is USD bearish, there is no reason to fight it. The long-term USD trend may still be up, but for now, the bears remain in control here (although that may not remain the case for much longer).
The main focus this week turns to the CPI inflation report on Thursday. We can expect as big a volatility as in the recent CPI releases. Another miss of consensus forecasts here will likely add more fuel to the bearish USD momentum.
However, as noted above, beyond the short term, it’s questionable how much more the dollar can fall. In this regard, chasing the USD move lower doesn’t seem like a good way to trade this.
EUR Fundamentals: Eurozone Inflation Is Also Dropping Like a Stone
The Eurozone economic data from the first week of 2023 brought interesting signals that overall confirm our view that “Europe is probably much weaker than the US already”. Namely, the flash CPI reports were released and - much like in the US - the figures missed expectations massively. The headline CPI was down to 9.2% from 10.1% in the previous month while also recording a big miss on expectations of 9.6%. Core CPI was more “sticky” and printed close to the consensus, but we’ll see for how long that can remain the case.
When it comes to leading PMI sentiment reports, in Europe, they are already below the “recessionary” 50.00 and have been there for a while. Yet, the euro has appreciated significantly in recent months, especially versus the US dollar. This is a little puzzling but can be best explained as part of a “corrective” sentiment shift on the US dollar. In essence, recent EURUSD moves are more a function of USD fundamentals than an improvement in EUR fundamentals.
That said, there is the hawkish shift at the ECB that is helping to fuel a further move higher in the euro. However, the ECB is hawkish because inflation is high, which is set to drop just as fast, if not faster than in the US. What happens when it becomes clear that the ECB can’t be hawkish for much longer? The euro reverting to a lower value seems like the natural outcome.
Nonetheless, over the near term, the momentum here is bullish, and further EUR gains are possible based on this. As the saying goes, don’t fight the trend, and as long as the market sentiment toward the ECB is hawkish, the euro can stay relatively supported.
The Eurozone economic calendar is light this week, so the EUR market action will remain driven more by external and global factors.
EURUSD Technical Analysis:
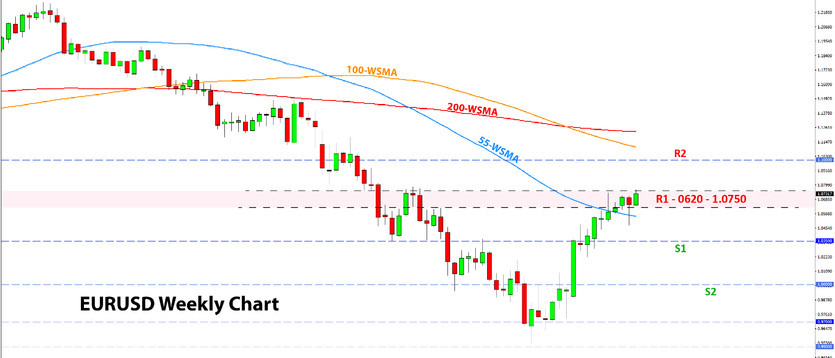
With the latest leg up, EURUSD is now making a serious test into the 0620 - 1.0750 resistance area, which is primarily formed by Fibonacci levels. As we discussed in previous weekly Fx posts, it is a crucial Fib zone where the key 38.2% and 61.8% levels are converging (as measured from the two distinct highs within the 2022 downtrend).
Despite the recent bullish moves, a bigger reaction here in the 0620 - 1.0750 Fib resistance still can’t be excluded. A renewed bearish attempt toward 1.05 (last week’s low) and a close under it would signal that the resistance here is holding. On the other hand, if EURUSD breaks higher, then the next resistance up would be 1.10.
To the downside, below 1.05, the next resistance is at the 1.0350 – 1.0300 area.
GBP Fundamentals: Risk Sentiment in the Driving Seat
Unlike the US or the Eurozone, the UK data calendar is in for a slow start to the new year. So far, no major market-moving economic data has been released from the UK, and the pound remains driven by global and risk sentiment factors in the first two weeks of the year.
The past week was another example where general USD weakness and positive risk sentiment helped lift the pound more broadly. However, GBP’s gains were concentrated mostly versus the safe-havens as other risk-sensitive currencies also rose (AUD, NZD, CAD).
Global risk sentiment is likely to remain in the driving seat for sterling for the time being. And as discussed above, the so-called “Fed pivot” and speculations around when the Fed may stop hiking rates or even begin cutting rates are the main news headlines that drive markets right now.
Stocks continue to hold up well for this reason, and as long as that is the case, GBP will hold up well too. However, if stocks start to fall more steeply, then we can likely expect similar bearish market action in pairs like GBPUSD, GBPJPY, and GBPCHF.
The again quiet UK calendar is unlikely to be a source of Fx volatility this week.
GBPUSD Technical Analysis:
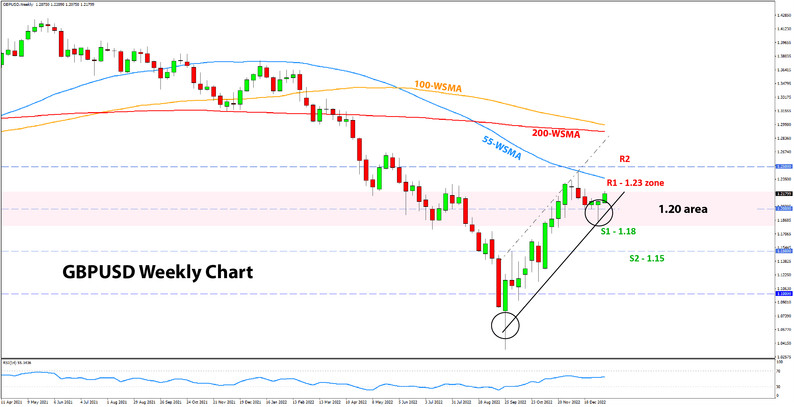
GBPUSD has bounced from a low of 1.1840 last week, which can be considered as the “wider” 1.18 support zone holding. There are previous highs here (visible on daily chart) and a rising support trendline (see weekly chart below).
GBPUSD is now climbing again and is close to the 1.22 level. The weekly chart resistance remains at the 1.23 and 1.25 zones. However, a more significant long-term resistance is the wider 1.20 area (highlighted in pink). In fact, all the moves on GBPUSD since December could turn out to be simply reactions to this wider 1.20 area, which may still hold in the end. Only a break above 1.25 would mean the 1.20 resistance has definitely been broken.
To the downside, 1.18 will be the key support zone as soon as GBPUSD crosses back under 1.20. Below it, traders will watch 1.15.
JPY Fundamentals: The Big Change from the BOJ Means Yen Strength Could be the New Trend
Following the sharp gains in the final weeks of 2022, the Japanese yen has taken a consolidative path to start the new year. The big news in late December was the decision by the Bank of Japan to increase their tolerance trading band for the 10-year Japanese bond yield from 0.25% to 0.50%. This was a decision that was long speculated in the Fx market, and although it is not a rate hike, the markets are almost taking it as such, which is why we saw such a huge move down across JPY pairs.
Undoubtedly, this is a big change from the BOJ. They’ve kept the 10-year bond yield band fixed near 0% since 2016, and this policy was the main reason for the massive JPY weakness during 2022. With this decision, the BOJ is essentially taking the first step to reverse that dovish policy, hence the huge moves.
Given the momentum behind the JPY move, further extension down for JPY pairs is possible and even looks likely. The markets will continue speculating that the BOJ can’t keep bond yields fixed anymore and that it will have to widen the band further. As you know, markets are driven by rumours and speculations, so the current momentum could be enough to drive further “JPY strength” from here.
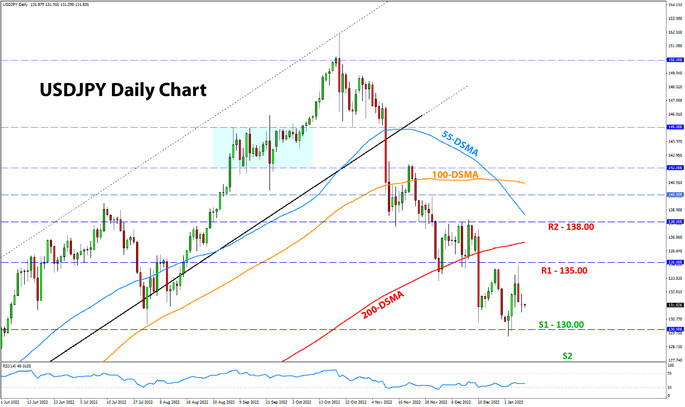
USDJPY Technical Analysis:
USDJPY continues in a gradual move down, with each bearish leg followed by periods of consolidation. Before the hawkish December 20 BOJ meeting, USDJPY was hovering above 135.00. Now it is the 130.00 level that has this role as support. A break under it could mean that the bearish trend is ready to continue.
In a bearish breakout scenario, Fx traders will watch the 128.00 and 125.00 support zones lower. These can be TP target areas and locations where USDJPY may bounce.
To the upside, resistance is at the aforementioned 135.00 zo