Trading based on the Trend Finder Daily strategy is an algorithm whose task is to find the optimal moment to enter or exit the current market within one trading day. The strategy includes only three indicators, but thanks to them the strategy was not only profitable, but also as simple as possible to use. The strategy can be used with any major currency pairs, however, the choice of timeframe should be taken more carefully. The best timeframe for this strategy is D1, but the possibility of using it on the H1 timeframe is not denied.
Strategy indicators
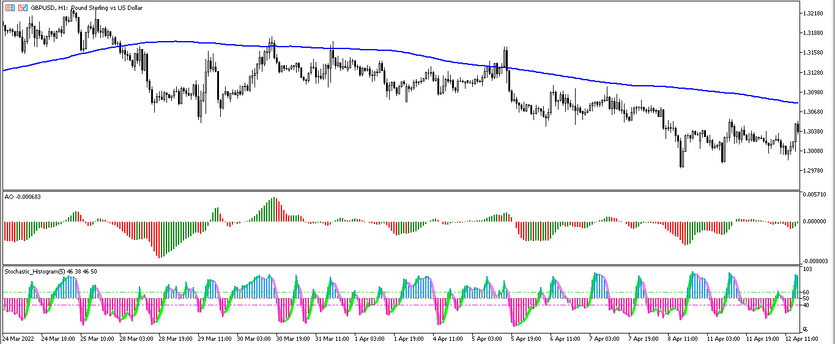
The Trend Finder Daily strategy includes three indicators, two of which are present in the standard forex set, and one of them is just a modification of the standard one.
- SMA (200) - simple moving average, the period of which is set to 200.
- Awesome Oscillator- technical indicator by Bill Williams designed to determine the current trend and its strength.
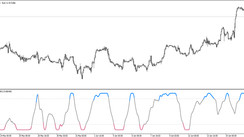
- Stochastic Histogram - Stochastic indicator, which is made in the form of a histogram. Its values remain unchanged, that is, 5,3,3.
Trading with the Trend Finder strategy
Trades using the Trend Finder Daily strategy are extremely simple, since the indicators included in it are used strictly for their intended purpose. That is, by generating their own signal, they confirm or, conversely, deny the signal of another, and the strategy is built on this. After the location of the signal candle relative to the moving one is determined, the value of the histograms of the remaining indicators is taken into account, and if all the conditions for opening a trade are the same, then a position can be opened in a certain direction. The main advantage of the strategy is that it makes it possible to make two trades in one trading day. Trading conditions for them do not change.
Conditions for Buy trades:
- The current candle should close above the SMA line.
- At this moment, the Awesome Oscillator histogram, after coloring with the growth value, should cross the zero level from the bottom up.
- The histogram of the Stochastic Histogram indicator should rise above the level of 50 and turn into a color with a growth value, like the signal line, which is also moving up.
After receiving such conditions, a long position can be opened at the opening of the next candle after the signal one. It should be closed with a stop loss and a take profit of 100 points, after receiving the opposite conditions, that is, for example, after the candles fall below the moving one. Since this is already considered as a signal to open a second trade.
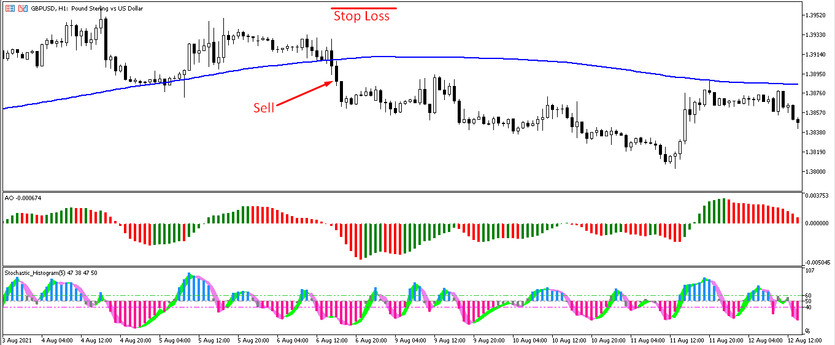
Conditions for Sell trades:
- The current candle should close below the moving average with a period of 200.
- Awesome Oscillator, after coloring with a fall value, should go below zero.
- Stochastic Histogram is identical to the Awesome Oscillator, it should also acquire a color with a falling value, and at the same time fall below its level of 50. And its signal line should move from top to bottom and be colored in a color with a falling value.
After the appearance of such conditions on the candle after the signal one, a sell trade can be opened. Such a trade should be closed after receiving the reverse conditions with a stop loss and take profit equal to 100.
Conclusion
The Trend Finder Daily strategy creates the simplest trading conditions, thanks to which any trade must go through with the maximum profit. In order to be able to use the strategy correctly, it is necessary not only to comply with all the trading conditions, but also to study the nuances of each indicator included in it, using a demo account.