The 50-week and the 200-week moving averages are some of the most important indicators that are always looked at by the pro traders. They act as support and resistance on the higher timeframes (most notably the daily, weekly and monthly) and crossovers between the two can also indicate major trend changes. This strategy is based on these two main principles related to the 50-period and the 200-week period averages and additionally uses the Stochastic Oscillator to determine potential trading opportunities.
Since it’s traded on the weekly chart, this strategy is of long-term nature which means that trades will not be generated frequently and trades need to be held for a longer period of time. You can expect trades to last anywhere between a few weeks and up to several months.
It's fairly easy to trade this strategy and there is scope for a degree of subjectivity and additional tools/indicators to be used with it. The required alignment of the moving averages ensures that the trader is taking trades in the direction of the prevailing trend only and helps to filter out trading opportunities of better quality.
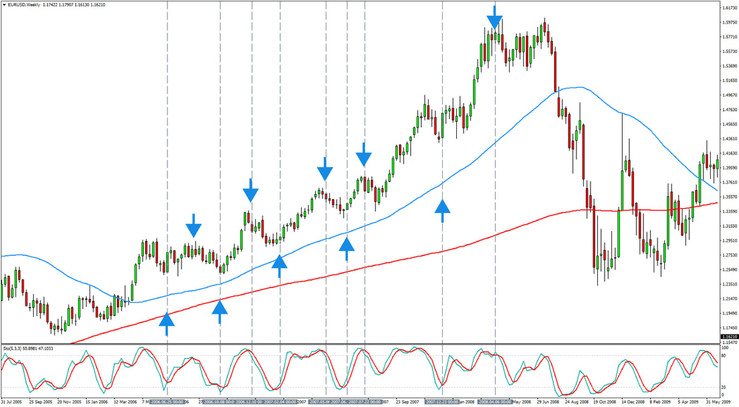
Below is an example of a trade generated with this strategy.
Examples of long trades that were generated on the AUDUSD weekly chart – up and down arrows indicate entries and exits respectively, the numbers 1 and 2 indicate the 1st and 2nd profit exit points
Indicators to be used:
We are going to use 3 indicators as follows for this weekly timeframe Forex strategy:
- 50-period simple moving average (SMA)
- 200-period simple moving average (SMA)
- Stochastic Oscillator
Trading conditions of the strategy:
Long trade entry:
- Wait for the 50-week MA to cross above the 200-week MA
Long trade stop loss:
- Behind bullish pattern on the chart
Long trade exit and targets:
- Target the 200-period or 50-period moving average to the upside
Here are examples of long trades of this strategy:
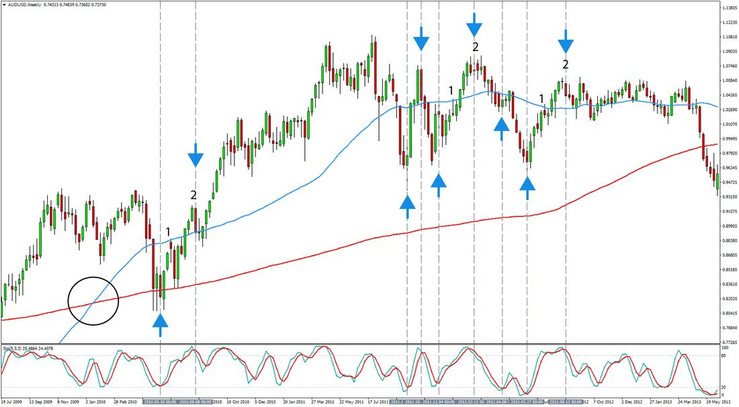
Examples of long trades that were generated on the AUDUSD weekly chart – up and down arrows indicate entries and exits respectively, the numbers 1 and 2 indicate the 1st and 2nd profit exit points. Bullish crossover marked with the black circle.
Short trade entry: Short trade stop loss:
- Wait for the 50-week MA to cross below the 200-week MA
Short trade exit and targets:
- Target the 200-period or 50-period moving average to the downside
Here’s an example of several short trades that were generated on a daily chart of AUDJPY. This strategy is best used on the weekly chart but can be used successfully on other timeframes as well.
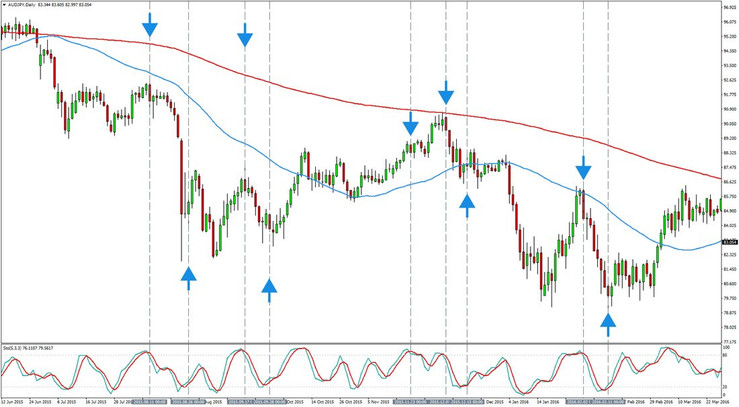
AUDJPY Daily chart – Several profitable short trades were generated – Down arrows indicate sell entry and up arrows indicate the exits
General guidelines for the strategy:
- Essentially, the principle of the strategy is to only take the Stochastic signals when they are in the direction of the larger market trend and only when the signals are in the same direction as the moving averages. That is we buy on the oversold Stochastic when the moving averages are bullish and we ignore bearish signals from the Stochastic. Conversely, we sell on the overbought Stochastic when the moving averages are bearish but no trades are taken on bullish signals from the Stochastic.
- The reverse signals from the Stochastic, however, are used for taking profits if the price has surpassed the moving averages and there are no other distinct profit target levels on the chart.
- A candlestick pattern or some other chart pattern confirming the stochastic signal is a great enhancement to any trading signal. Thus, whenever one occurs together with a signal from the Stochastic, it’s usually a much more solid signal than either one existing alone.
- Being mindful of key support and resistance areas us always helpful, and especially on the weekly chart. Weekly support and resistance are normally significant levels that will almost surely produce a reaction in the market. So, although not required, aiming to align the trades with support and resistance levels will enhance the strategy even more.