This strategy is designed to profit on joining already existing trends in the market and rests on two indicators developed by Welles Wilder – a great technical market analyst and inventor of technical indicators.
The indicators we will use for this strategy are the 14-period ADX and the Parabolic SAR, both widely popular and extensively used in trading the markets.
The ADX is a unique indicator that shows the characteristics of a particular trend. The ADX tells us when there is a trend and also when there is no trend, so we know when to use a trend following strategy and when to use a range trading strategy.
For this trend-following strategy, we’ll look for the ADX to signal trending market conditions.
First, it’s important to understand how the ADX works. The ADX line only shows how much the market is trending at the moment, regardless of direction. So whether it’s a bearish or bullish trend the ADX line will go up if the trend steepens. An ADX value of 25 or greater indicates trending markets while an ADX reading of 20 or below indicates ranging markets.
Now, the ADX has two other lines in addition to the ADX line, the +DI line and the –DI line. It is these lines of the ADX indicator that show the direction of the trend. When the +DI line is above the –DI line the trend is bullish and when the –Di line is above the +DI line the trend is bearish.
We’ll look at some examples below to show how all this works.
We will use the Parabolic SAR as the trigger signal alongside with the +DI and –DI lines to initiate new positions.
Of course, as with any trading strategy, it’s important to be aware of key support and resistance levels as well as any fundamental events that could affect the currency pair.
Entry rules:
Long :
- ADX above 25
- +DI line crosses above –DI line
- Parabolic SAR reverses and gives a bullish signal
Short:
- ADX above 25
- +DI line crosses below –DI line
- Parabolic SAR reverses and gives a bearish signal
As we can see on the 4-hour EURUSD chart, the ADX line (thick blue below the candles) tends to move above and below the 25 level (dotted gray).
We have marked the area on the chart where a signal occurred according to this strategy. The ADX was above 25, the +DI line crossed above –DI and the Parabolic SAR reversed at about the same time.
For a timely signal, it’s best for the crossover of the +DI and –DI lines to occur together with the reversal in the Parabolic SAR, with some 2 – 3 bars maximum lag between the two signals. Otherwise, the signal may be lagging behind price and it’s more likely that it will be too late for the trade.
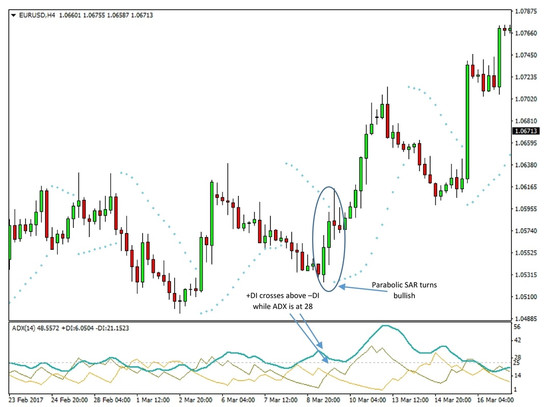
An example of a long entry using this strategy
Initial Stop-Loss Placement:
We use the Parabolic SAR to place the stop at entry and also to trail the stop as the trade progresses.
An important support or resistance level can be used as a stop-loss if it doesn’t threaten the main conditions of the trade (as per the ADX).
One of the great things about the ADX, and with it of this strategy, is that we can quickly reverse positions and make hefty profits in both directions as the market aggressively reverses and trends in the opposite direction.
On this 4-hour GBPJPY chart, we can see how we could have profited handsomely in both directions successively.
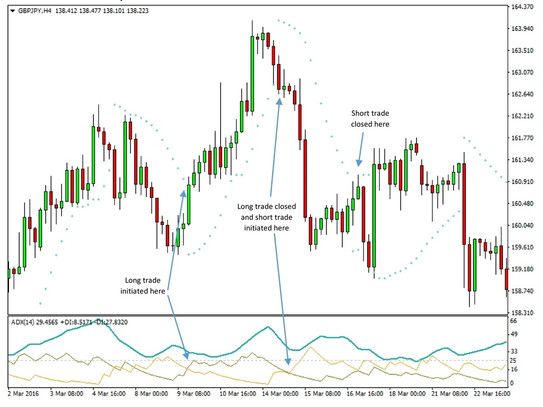
An example of a long followed by a short entry
Managing the Opened Trade:
As a rule, we stay in the trade for as long as the Parabolic trailing stop is not taken out. So even if the other conditions for the trade (the ADX line and the +DI and –DI positions) change for a brief time (2-3 bars) the trade should remain open.
However, if the ADX falls below 25, or the +DI and –DI lines reverse in the opposite direction and stay there for several trading sessions (4 – 5 bars or more) then there is no need to wait for the Parabolic trailing stop to be taken out, but rather it’s recommended to manually close the position even at breakeven or a small loss because trading conditions have now changed.
An example of such a case is shown on the following USDJPY 1 hour chart.
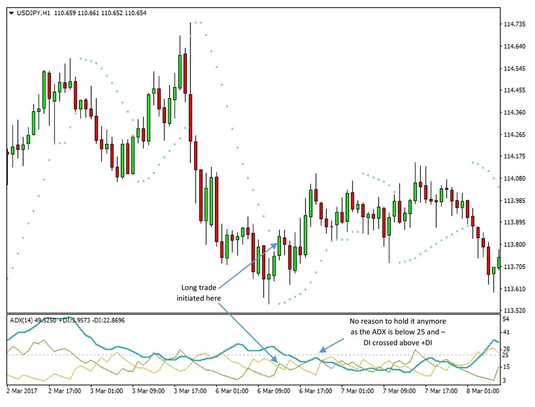
USDJPY 1h chart
We can see how we initiated the trade on a reversal in the Parabolic SAR and the +DI line crossing above the –DI. However, immediately the next session +DI crossed back below –DI and stayed there for 2 sessions before crossing above again. However, the ADX kept declining and remained below 25 indicating there is no trend here anymore.
The right decision here was to exit the trade at breakeven or a small profit after the ADX stayed below 25 for 4 – 5 sessions.