Gold has attracted much interest again lately, especially as its price surged again above $2000 per ounce following the SVB and Credit Suisse banking crisis. In all this, gold has continued to mainly trade in tandem with the broad trend of the US dollar and Treasury bond yields.
Both Treasury yields and the dollar were falling, and gold was rising during the 2nd half of March. The declines in both those have slowed in April, and so has the rally in gold. While still in an uptrend, the yellow metal has now formed an upward-sloping channel (daily chart shown 2nd below) that could even shape into a consolidative formation.
Triple top on monthly chart?
The weekly and monthly charts show potential for a triple top. This is very significant. It implies that the resistance here is strong and an easy breakout is not going to happen. Yes, Peter Schiff and other gold bugs will always predict that the gold price only moves up. But factual evidence suggests that – gold – like other markets, experiences periods of both uptrends and downtrends.
Before a breakout above the triple top happens, it’s not wise to bet that one will happen. The price continues to play with the 2000 level after being rejected here a few times since mid-March. A downside correction could easily take gold back to 1800 or even lower.
A major breakout above 2000 didn’t happen during the Covid pandemic nor last year when Russia started the war in Ukraine. There are fewer fundamental reasons for such a breakout today.
That said, there will be, of course, significant upside potential in case of a bullish breakout above the triple top, and gold could quickly reach the $2500/ounce area. But for that, a very dovish Fed will be needed and probably a new round of QE stimulus, both of which look rather unlikely in the current inflationary environment.
Daily chart to determine near-term direction
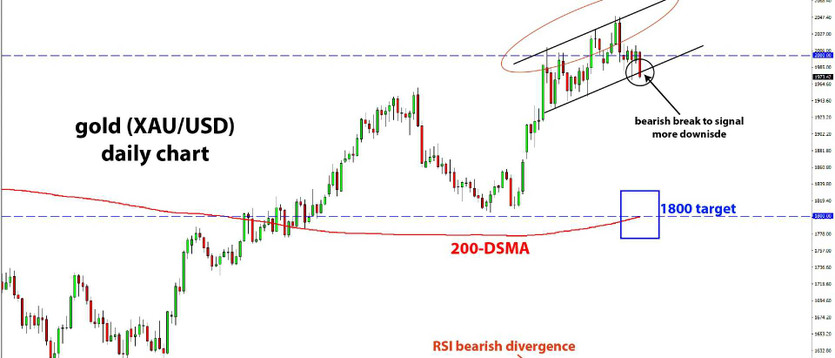
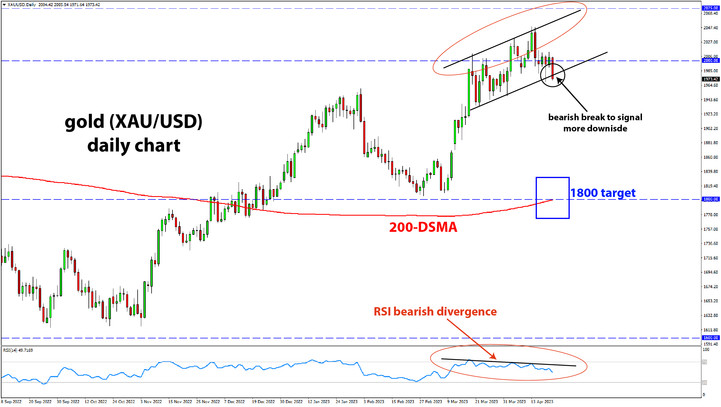
The daily price action has formed a channel that is moving up but with weak momentum. The RSI is showing massive bearish divergence here on the daily chart. This is not indicative that a bullish breakout is imminent.
The potential for a downside correction would be opened in case of a breakdown of this channel formation. A break of the support line around 1950 - 1980 would constitute a bearish signal in the current context on the chart.
Under such a scenario, gold could quickly reach 1800 as there is no strong support zone until this level.
Trade Plan for potential short trade:
Entry:
- Bearish break of the support line around 1950 - 1980
Stop loss:
- Above the most recent swing high; that is likely above the 2000 level
Target:
- 1800 zone
Trade signals from the past weeks
- February 7, 2023 - Short EURCHF from 0.99 (open & in progress)
- April 14, 2023 - Short EURJPY trade idea sent, not triggered, 1H chart setup now canceled
- April 14, 2023 - Long AUDNZD from 1.08 (trade idea sent April 6) as described here
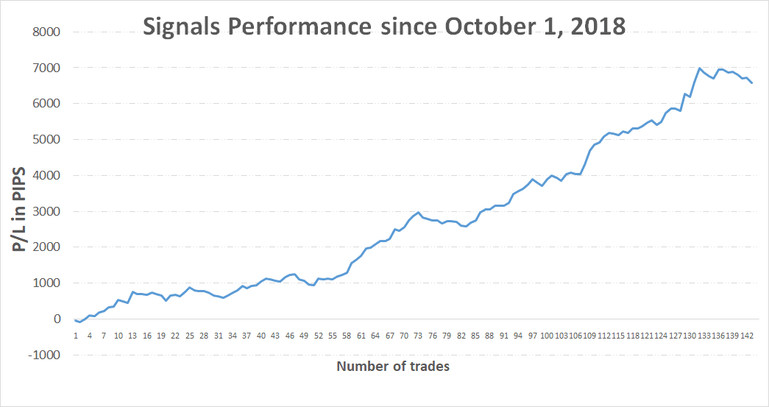
TOTAL P/L in the past weeks: N/ATOTAL: +6585 pips profit since October 1, 2018