Since last summer, EURJPY has been trying to grind higher but has mostly stayed range bound. As we can see on the weekly chart shown below, there were many attempts for EURJPY to move higher, but it has failed each time so far.
Now, the pair is again approaching the resistance at the upper part of this range. If this resistance holds, we can expect some interesting bearish opportunities to be created on the shorter-term EURJPY charts.
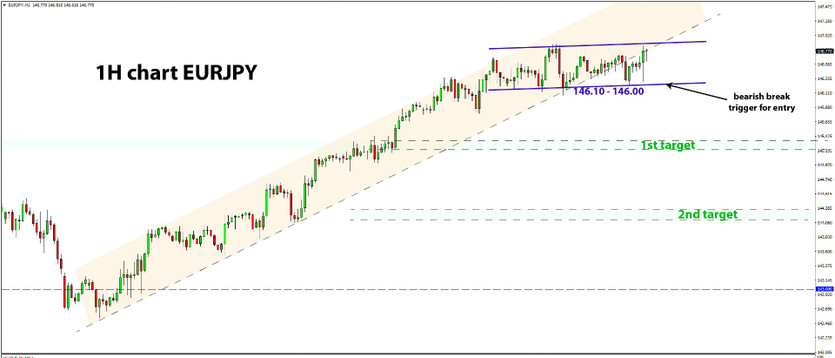
For this purpose, we switch to the hourly timeframe, where we can see the most recent bull leg climbing higher steadily over the past week. But putting this rally into the context of the weekly chart and the massive resistance that exists at these levels at 145.00 to 148.00, then this rally looks like a good opportunity to look for bearish setups.
With today’s EURJPY action, this uptrend seems to have broken now. EURJPY is trading below the support line of the uptrend, marking the end of this short-term rally on the hourly chart. Considering that the whole move is around 400 pips, even a 38.2% or a 50% retracement to the downside can give 150 - 200 pips of bearish potential.
Below we discuss the trade plan for such a scenario.
Trade Plan
Now that we have a bearish break of the uptrend on the 1H chart, we need to look for further confirmation of the reversal. So far, there hasn’t been a lower low, which is a sign the bulls have still not given up here.
The current low is located at 146.10. We need a bearish break below this low to trigger a reversal pattern and confirm the bears are starting to take control of this market.
Once we have a bearish move below 146.10 (and the 146.00 round number), then there is little support until 146.30-40. This zone is where the previous highs are located, converging with the 38.2% Fib retracement. It is the 1st target for this trade setup.
Entry:
- Short entry on a bearish close below the 146.10 - 146.00 zone on the 1H timeframe.
Stop loss:
- Above the most recent swing high (currently 146.80);
- Thus, stop can be above 147.00
Target:
- 1st - 38.2% Fib 146.30 - 146.40
Trade signals from the past weeks
- February 7, 2023 - Short EURCHF from 0.99 (open & in progress)
- April 6, 2023 - Long AUDNZD, setup not triggered yet, waiting for a weekly close as described here
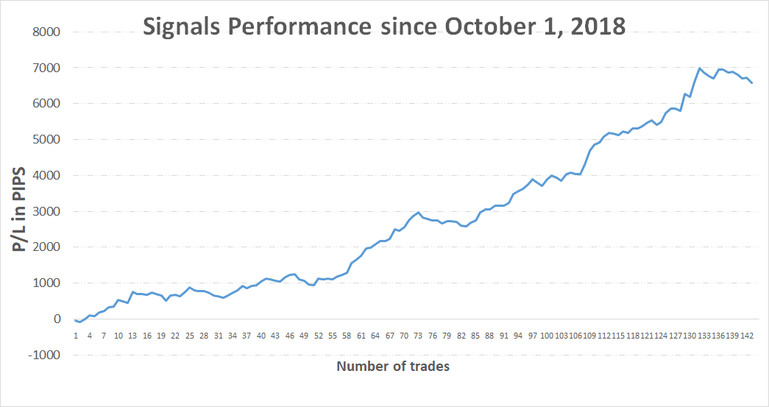
TOTAL P/L in the past weeks: N/ATOTAL: +6585 pips profit since October 1, 2018