In the alternative scenario, USD/CAD will In the meantime, in general, the positive dynamics of USD/CAD remains. The pair remains in the bull market zone, trading above the key support levels 1.2540 (EMA200 on the monthly chart), 1.2635 (EMA200 on the daily chart).
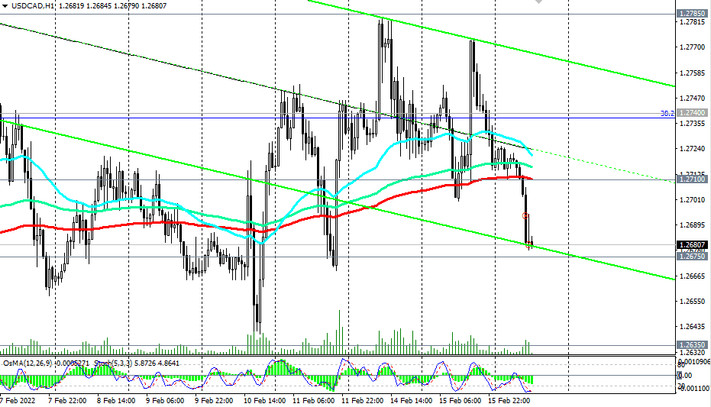
Upon resumption of growth and after the breakdown of the local resistance level 1.2785, USD/CAD will head towards the long-term resistance level 1.2870 (EMA200 on the weekly chart). Its breakdown will lead to a complete recovery of the USD/CAD bullish trend with the prospect of growth towards the upper border of the rising channel on the weekly chart, passing through 1.3100, and the first signal for the implementation of this scenario will be a breakdown of the important short-term resistance level 1.2710 (EMA200 on the 1-hour chart).
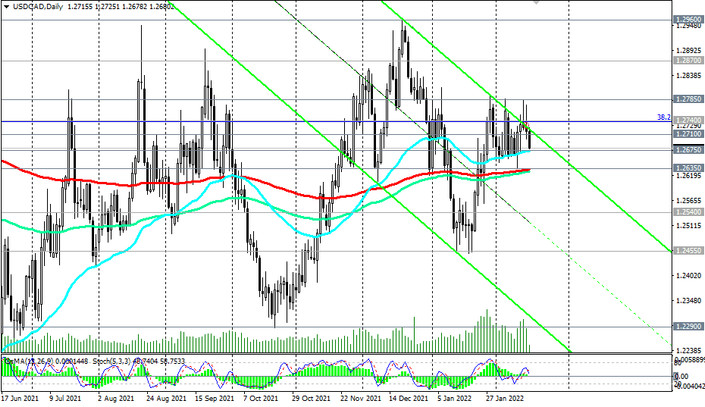
In the alternative scenario, USD/CAD will continue to decline towards the key support level of 1.2635. Its breakdown may reinforce the negative dynamics of USD/CAD, sending the pair inside the descending channel on the daily chart. Its lower border passes through 1.2290 mark.
Support levels: 1.2675, 1.2635, 1.2600, 1.2540, 1.2455, 1.2290, 1.2165, 1.2010
Resistance levels: 1.2710, 1.2740, 1.2785, 1.2870, 1.2900, 1.2960, 1.3100
Trading scenarios
Sell Stop 1.2665. Stop Loss 1.2730. Take-Profit 1.2635, 1.2600, 1.2540, 1.2455, 1.2290, 1.2165, 1.2010
Buy Stop 1.2730. Stop Loss 1.2665. Take-Profit 1.2740, 1.2785, 1.2870, 1.2900, 1.2960, 1.3100