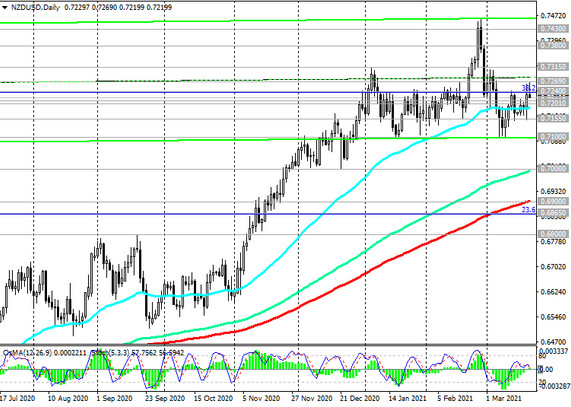
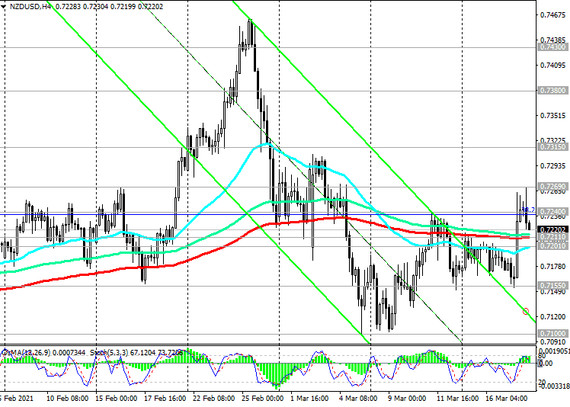
At the time of publication of this article, the NZD / USD pair is traded in the zone above the important short-term support levels 0.7201 (EMA200 on the 1-hour chart), 0.7211 (EMA200 on the 4-hour chart), generally maintaining positive dynamics amid a weak US dollar and positive sentiment investors regarding the further recovery of the global economy after the coronavirus pandemic.
Remaining to trade above the key support levels 0.6970 (ЕМА200 on the monthly chart), 0.6900 (ЕМА200 on the daily chart), 0.6800 (ЕМА200 on the weekly chart) and in the ascending channel on the weekly chart, NZD / USD maintains long-term positive dynamics. Nothing threatens long positions on NZD / USD above the support levels 0.7211, 0.7201.
Probably, in the event of a confirmed breakdown of the local resistance level of 0.7269, the growth of NZD / USD will continue towards the resistance levels 0.7380, 0.7430, 0.7550 (Fibonacci level 50% of the correction in the global wave of the pair's decline from the level 0.8820 and the upper border of the ascending channel on the weekly chart).
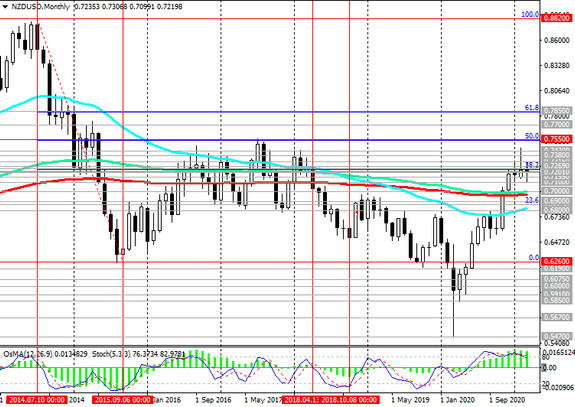
In an alternative scenario, NZD / USD will resume its decline to the support levels 0.6900, 0.6865 (Fibonacci 23.6%), 0.6800. A signal for the implementation of this scenario will be a breakdown of the support level 0.7201, and a breakdown of the support level 0.6800 will significantly increase the likelihood of a further decline in NZD / USD and its return to the global downtrend that began in July 2014.
Support levels: 0.7211, 0.7201, 0.7155, 0.7100, 0.7000, 0.6900, 0.6865, 0.6800
Resistance levels: 0.7240, 0.7269, 0.7315, 0.7380, 0.7430, 0.7550
Trading recommendations
Sell Stop 0.7190. Stop-Loss 0.7275. Take-Profit 0.7155, 0.7100, 0.7000, 0.6900, 0.6865, 0.6800
Buy Stop 0.7275. Stop-Loss 0.7190. Take-Profit 0.7315, 0.7380, 0.7430, 0.7550