
We as humans feel comfortable with patterns, which are homologous with habits, and from that, we can see and start patterns anywhere we go without even noticing a lot of the times we do!
Thankfully, that also is true for and can be applied to trading. These patterns, once identified, can give you significant clues regarding where the price will head, usually with high accuracy.
Here, we’ll delve into the most important and popular chart patterns and how to trade them on cryptocurrency charts.
Double Tops & Double Bottoms These show up as two mountains, and they're some of the most common and reliable patterns in trading.
They form after the price action meets the resistance or support twice, and they usually signify a loss in momentum, so a reversal is very likely.
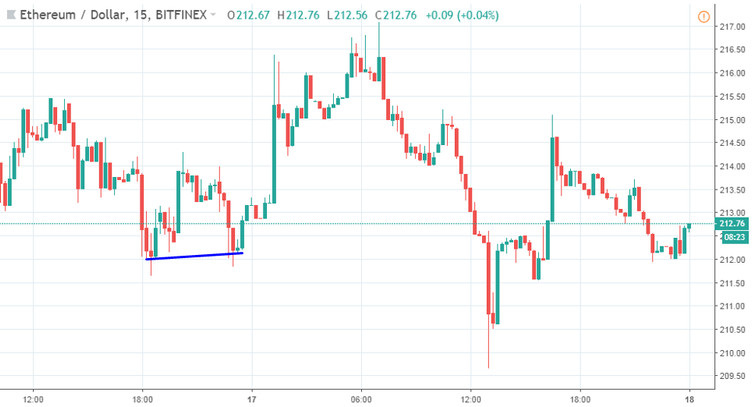
In this 15m chart, we can see how a massive upwards trend started right after the second bottom!
A good place for a stop-loss order would be below the lowest point of the first or the second low of the double bottom pattern (depending on which one is lower), and a good take-profit would be the upper base - resistance between the swings forming the double bottom pattern.
And as with every other pattern that we are going to discuss here, the bearish version of this pattern (known as double top) looks exactly like a mirror image and is only traded in the opposite direction.
Head And Shoulders A Head and Shoulders pattern forms when the double top or bottom gets a higher spike in the middle. Likewise, it also signals an upcoming reversal.
In the same chart, we can see a Head and Shoulders pattern emerging. Here, a good place to enter a SELL order was after the market started to fall when the Head and Shoulders pattern was confirmed (after the third bearish swing - the right shoulder), with a stop-loss above the Head (the middle swing), and take-profit at the nearest support.
Flags and Pennants These are different from the previous two in that they often signal continuation of the current market trend. They form after a steady trend meets a sideways trend or correction as traders take a break, but the price quickly breaks above this brief trend's limits, continuing the previous momentum.
In this 5m Bitcoin chart, we can see both a flag (blue) and a pennant (green) pattern (this one is usually similar to the triangle pattern) form:
As you can see, the trend continues after a brief break in both cases. Usually, the best way to approach this is to open a trade as soon as the pattern is confirmed (broken out), place the stop-loss at the opposite side of the entry price (below the lowest or highest price level of the chart pattern), and your take-profit above the nearest support or below the nearest resistance.
Also, one more popular technique can be used for placing Take-Profits that I will show you at the end of this article.
Triangles Triangles can come in two shapes: symmetrical or asymmetrical. The former only lets traders know that a breakout is coming with no clear direction, but asymmetrical triangles point out the direction of the breakout, usually in the direction of the straight side of the triangle pattern.
Here, you can spot an ascending triangle on the left side, and a symmetrical one on the right.
I personally trade both versions of the triangle pattern, both symmetrical triangles as well as asymmetrical. You can see that the first blue triangle was broken in the straight side of the pattern. And in case of the second triangle pattern, the breakout direction wasn´t clear before the breakout happened, but the trade in the direction of the breakout was nicely profitable here as well.
Cup and Handle Let´s take a look at this 1m Ether chart that shows this chart pattern clearly:
It's not difficult to spot the form of a cup and a handle. This chart pattern indicates that an upwards trend is taking a break, but will continue higher after the form shows up and the high of the handle is broken further upwards.
As you can see, the trend keeps going much higher after the handle forms, so it would be a great idea to go long after the handle, with a stop-loss at the lowest point in the handle. A Take-Profit target can be set to the nearest resistance or based on the technique that I am going to show you right after the following last chart pattern.
Wedges
Wedges are pretty much the same as triangle patterns, but they are usually ascending or descending.
The ascending wedges signal an end of bullish trend and correction and that the bearish breakout will come soon.
The descending wedges signal a bullish trend is likely to emerge soon.
How to set profit targets with chart patterns? Here is an easy and profitable technique for placing profit targets for trading triangle chart patterns.
This is the trade that I made based on a triangle pattern and in the chart you can see how I exactly traded it.
Wait for the breakout of the pattern and as soon as the breakout happens, open a SELL trade.
Place the Stop-Loss above the triangle pattern. And now the interesting technique regarding placing Take-Profits.
Every chart pattern is created by various price swings and here, on the previous chart, I highlighted the 1st swing that started the whole triangle chart pattern. When the breakout happened, I simply projected the length of this swing exactly from the point of the breakout of the triangle pattern.
And this is the Take-Profit target.
You can see for yourself how accurate it was in this case. There were no support levels that could be used for placing a Take-Profit in this case - only empty chart space - so without this technique, it would be pretty unclear where it is the best to place the Take-Profit.
As you are probably thinking now, this technique can be used in pretty much the same way with pretty much every other chart pattern as well.
It seems easy and it can be! Trust me, if you gain enough experience, knowledge, and education, only these chart patterns are enough to make profitable trades on Bitcoin and other Cryptocurrencies.
Of course, there are other important aspects to staying a profitable trader over the long run, and for that, be sure to visit our sections about trading psychology and money management.
Below you can also see a nice overview of various chart patterns: