The Inside RVI strategy is designed for trend trading and is based solely on standard forex indicators. In fact, the Inside RVI strategy is very easy to use, despite the fact that its method of application is somewhat different from other similar trading strategies. It is based on three indicators, which work in a strategy on confirming each other's signals, that is, any trade during a certain trend is opened at the moment when the main indicator determines the direction of the trend, and the rest confirm it. In this case, the current trend will need to be determined on a different timeframe, which is key difference of the trading algorithm.
The Inside RVI strategy is suitable for any currency pairs and timeframes above M5.
Strategy indicators
The Inside RVI strategy includes only three indicators, each of which is included in the standard forex set, which further confirms their effectiveness. Also, almost all indicators remain with the same input parameters, while it is not denied that the indicators can be used with other values adapted for the selected currency pair or timeframe.
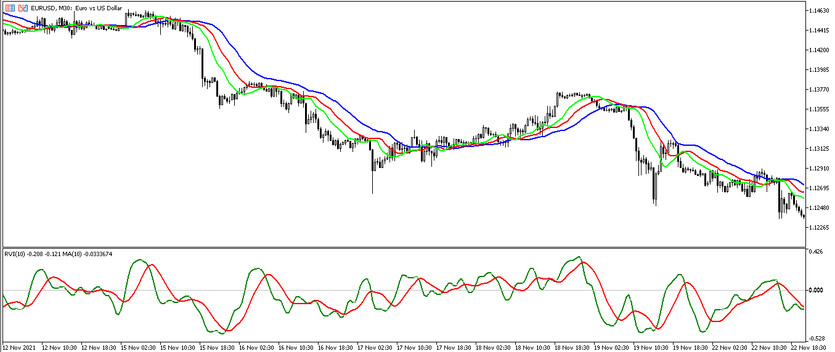
- Alligator - trend trading indicator. Its periods are 13,8,5, and shift values are 8,5,3. Smoothing type is set to Smoothed, and price type to be used is Median Price.
- RVI - indicator of the market volatility index. Its period is 10, while a signal level of 0 is added to its window. In this strategy, its signal line is not used at all, and therefore its color is equal to the background color.
- SMA - simple moving average that is set in the RVI indicator window and serves as a signal. It should be applied to Previous indicators data.
Trading with the Inside RVI strategy
In order to open a certain trade using the Inside RVI strategy, no special efforts are required, just some values are needed to be taken into account. If trading is made on the timeframes of the M group, the current trend is checked on the timeframes of the H group, if on H, then the trend is determined on the D intervals, and so on. Moreover, the most accurate is trading on the M intervals. This is done using the Alligator indicator. Then, returning to the selected timeframe, it should pay attention to the intersection of the RVI and SMA lines, as well as their location relative to the 0 level. And thus, at the opening of the next candle after the signal one, on which all conditions match, a certain position can be opened.
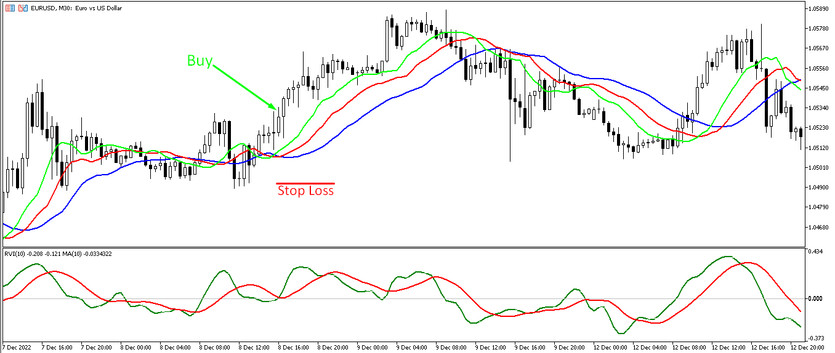
Conditions for Buy trades:
- On a timeframe higher than the current one, the Alligator indicator is moving up, and its lines are in the order of 5,8,13.
- Then, on the timeframe used, on the signal candle, the RVI and SMA lines are above the level of 0, while after crossing the RVI above the SMA.
Upon receipt of a complete combination of conditions that characterize an uptrend, at the opening of the next candle, a buy trade can be opened. Stop loss is set at the local extremum point, in the amount of at least 15 points. Such a trade should be closed after the Alligator lines cross again on a timeframe above the current one. At this moment, when the current trend changes, opening of new trades can be considered.
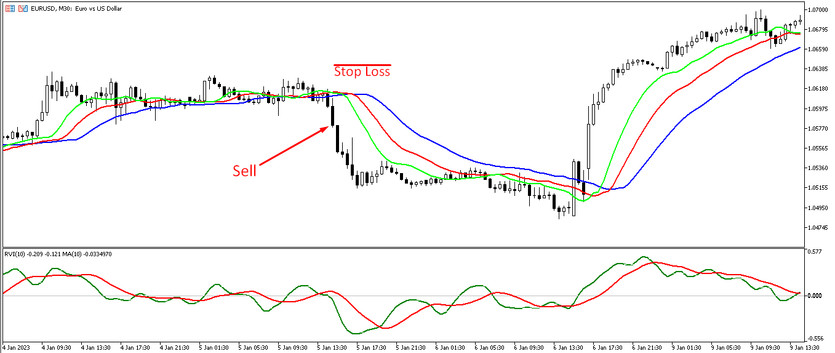
Conditions for Sell trades:
- On a timeframe higher than the current one, the lines of the Alligator indicator move down and are arranged in the following order: slow on top, followed by medium, fast on bottom.
- Returning to the selected timeframe, the intersection of the RVI and SMA lines of level 0 downwards is taken into account, as well as their intersection at which the SMA is higher than the RVI.
After receiving such conditions, a short position can be opened on the candle that opens after the signal one, due to the presence of a downtrend in the market. A stop loss order is placed at a recent local extreme point or at least 15 points in size. The position should be closed after the Alligator indicator gives a reverse signal on a timeframe higher than the current one, that is, its lines will begin to intersect with each other. At this moment it should be considered the opening of new trades due to a possible change in the current trend.
Conclusion
The trading strategy Inside RVI is very accurate, as the indicators included in it are very effective, which has already been proven by time. Its method of application is somewhat different from other strategies, but this is precisely what makes it more accurate and effective. In order to be able to use the strategy correctly and avoid unforeseen situations, preliminary practice on a demo account is recommended, which will allow not only to use the strategy correctly, but also to instill the necessary trading skills.
You may also be interested The DEMA MACD trend trading strategy