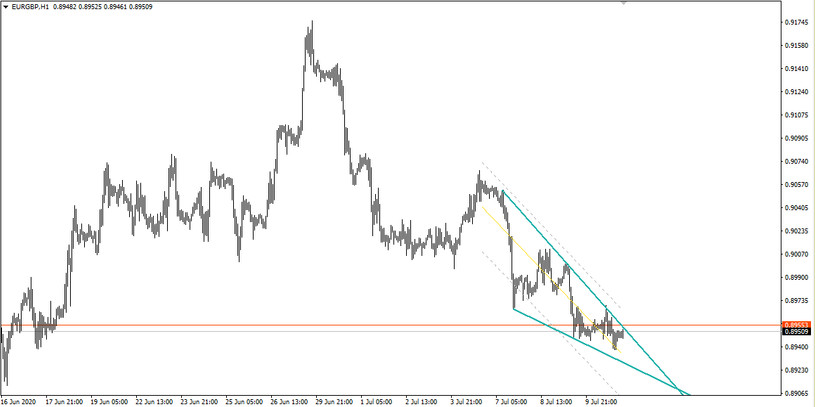
A wedge figure is considered a well-known model of a price reversal in technical analysis on Forex. It may not occur as often as a flag and a pennant but often indicates the upcoming U-turn. These models also belong to triangles but have their own essential features. One of them is that the Wedge figure may indicate a further development of the situation. For example, the upward Wedge pattern indicates that a decrease will follow, and the downward one, on the contrary, warns about the beginning of an uptrend.
The variant when the market forms a price configuration on the charts in the form of a cone of highs and lows converging in a narrow zone is called a wedge.
The main problem of determining and finding a simple (it would seem) Wedge figure for traders is the subjectivity of the market assessment. It often happens that a trader finds a figure where it really is not. Or vice versa, it may skip a clearly formed figure on the price chart. This is a fine line of human perception, depending on the totality of evaluative knowledge and desires of the subject.
In order not to get confused in this and to exclude subjectivity from the market assessment, the Wedges indicator exists when finding the Wedge figure. This useful tool is designed to work on any timeframe and can be applied to any trading asset. The indicator has input parameters, a certain set of which helps to more accurately and clearly define this pattern depending on the timeframe and trading asset.
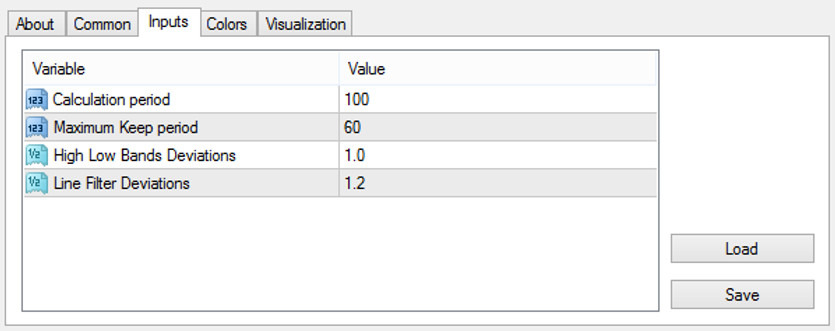
Indicator Settings
Calculation Period. This parameter is responsible for the number of last candles that will be taken into account when building the wedge.
Maximum Keep Period. Changing this value will affect the duration of the calculation of the trend line and wedge.
High Low Bands Deviations. This parameter is responsible for tolerance when calculating trend lines.
Line Filter Deviation. Determines the allowable deviation of the midline of the trend when plotting.
Conclusion
The Wedges indicator is a very useful tool that is especially convenient to use in strategies that modify the Wedge graphical analysis pattern. This tool will save you from the possibility of a double interpretation of the price when finding this figure.