
The Trend direction and force indicator is designed to determine the direction and strength of the current market trend. Its operation is based on the values of the double smoothed exponential moving average (DSEMA), which allows to make a more profitable trade with a small number of false signals.
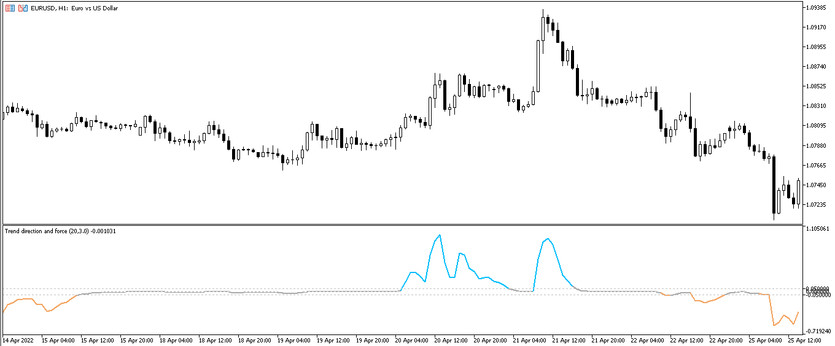
The indicator is located in the lower window of the price chart and represents it is a solid line that changes color. Also, three levels are visible in the indicator window, which the line crosses from time to time. The Trend direction and force indicator can be used on any time interval with any currency pairs.
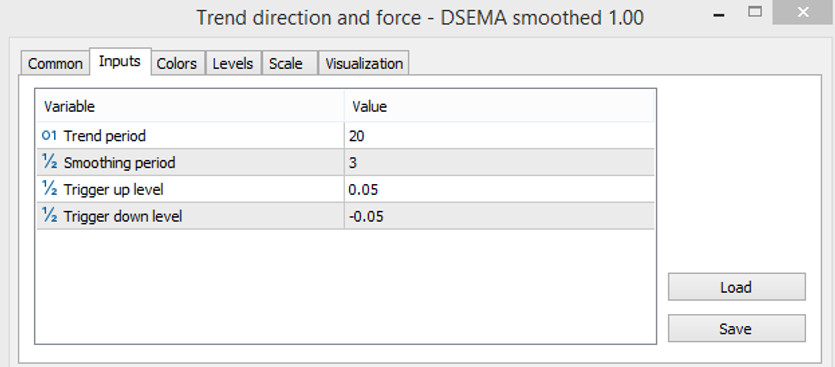
Input parameters
The following parameters can be changed in the indicator settings:
- -Trend period-parameter of the period to which the calculation will be applied when determining the trend in the market. The larger the value of the parameter, the fewer signals there will be, but at the same time they will be more accurate, respectively, the smaller the value, the more signals, but the less likely they are precision. The default value is 20.
- -Smoothing period-period parameter to which the calculation of the smoothed moving line will be applied. The default value is 3.
- -Trigger up level - the level of the indicator, when the line crosses it, an uptrend will be determined. The default value is 0.5.
- -Trigger down level - the level that will determine the downtrend if the indicator line crosses it from top to bottom. The default value is -0.5.
In the indicator settings, at the own discretion, it can be also changed the color scheme and width of the indicator, as well as added additional levels, at the intersection of which a signal will be generated.
Indicator signals
The main signals of the Trend direction and force indicator will be the change in the color of the line, its distance from the level 0 and the intersection of the levels -0.5 and 0.5. The change in the color of the lines will determine the market trend: upward, downward or the presence of a flat in the market. Since the indicator signals may be a little late , the definition of a flat in the market will be an excellent opportunity to enter positions. The strength of the trend will be determined by the distance of the line from level 0. The further the line is from level 0, the stronger the current trend.
Signals for Buy trades:
- -The indicator line for at least three candles has a color value of growth, which indicates the presence of an upward trend.
- - The line has crossed the level 0 from the bottom up and is above the level 0.05.
The trade should be closed if:
- -The indicator line has changed its color, indicating the end of the uptrend.
- -The line changes direction and moves from top to bottom to level 0.
- -A flat has been determined on the market, which indicates the absence of a trend in the market.
Signals for Sell trades:
- - A downtrend has been determined on the market, that is, the indicator line has a fall value.
- -The line crosses level 0 from top to bottom, and then crossing level -0.05 moves away from level 0.
A sell trade should be closed if:
- -The color of the line has changed and indicates an uptrend.
- -The line changes direction, moving up closer to level 0.
- - The line turned into a color that characterizes a flat in the market.
Conclusion
The Trend direction and force trend indicator can be used both without additional tools and indicators, and with them, forming a profitable and accurate strategy. Due to the doubly smoothed signals, the indicator makes very accurate calculations. However, the delay of its signals is not denied, so it is still recommended to use additional indicators along with it, as well as using a demo account to allow to more accurately study the technique of the indicator.


