The Traders Dynamic Index indicator is a hybrid instrument, the main task of comprehensively determining the market's state. With the help of the TDI indicator, a trader can monitor the market situation from different angles. It helps assess the direction and strength of a trend, as well as market volatility.
TDI is based on the standard RSI indicator that determines the current trend's strength or the rate of price change. The moving average algorithm is used to smooth the lines, and Bollinger bands are used to estimate the oscillation amplitude. Thanks to an integrated approach, the TDI indicator alone can be used as a complete trading system.
This trading instrument simultaneously shows the direction and speed of the current trend, by which a trader can determine the right moment to enter a trade. Despite its complex nature, it is quite easy to understand the work of the indicator.
Indicator settings
The following parameters are available for changing and editing in the settings of this tool:
RSI_Period is a period for calculating the RSI indicator. A value between 8 and 25 is recommended. The optimal period is 13.
RSI_Price is the selection of the reference price for the Relative Strength Index. The default is the closing price.
Volatility_Band - used to calculate the volatility boundaries of Bollinger Bands. The lower the value, the more sensitive the lines are to changes.
RSI_Price_Line - smoothing the Fast RSI line.
RSI_Price_Type - anti-aliasing method. By default, Simple average.
Trade_Signal_Line is a period of smoothing of the slow RSI line.
Trade_Signal_Type is a line smoothing method.
These parameters are basic for the indicator and affect its calculations. All other parameters are for visual and audible settings of the TDI indicator.

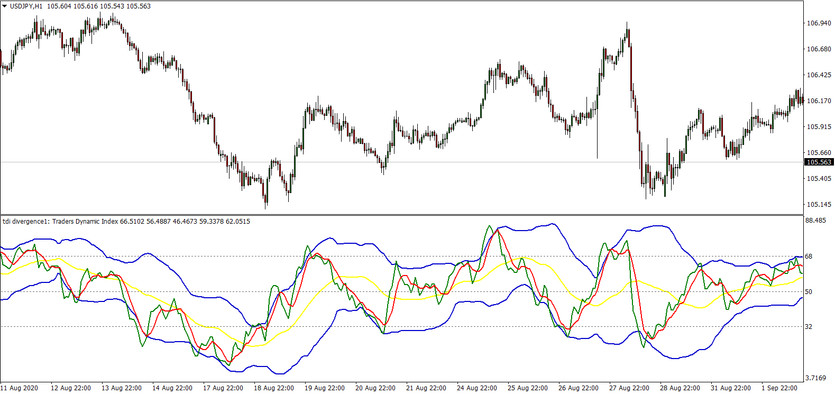
The green line in the TDI window is a smoothed RSI line with a short period. Red has a more extended smoothing period and is called Signal Line. RSI is not used in its pure form; its values are used only for calculating fast and signal lines.
Bollinger Bands are also plotted using RSI readings, but not smoothed values. The orange line in the middle between the upper and lower channel lines. Actually, these three lines reflect market strength and current volatility.
Indicator signals
First of all, the indicator can be used to determine the current trend. The green line above the red one signals a change in the short-term trend to an upward trend. When green dips below red, the short-term trend changes to a downtrend.
The yellow line indicates a long term trend. Most of the time, it does not go beyond the boundaries of levels 68 and 32. When the line repels from these boundaries, it signals a possible trend change.
The indicator also signals current market strength. Typically, the greater the slope of the green line, the stronger the market players. If the line moves horizontally rather than vertically, we are dealing with a too inert market.
The expansion of Bollinger Bands signals an increase in volatility. The narrowing of the lines, on the contrary, indicates a decrease in volatility and a weakening of the market. With a substantial narrowing of the lines, one should expect to release any important reports or other news that can dramatically move the market. In such cases, it is better to temporarily refrain from trading.
Conclusion
The TDI indicator was created as an independent trading system, but with the help of additional filters or other auxiliary indicators, we can get better signals to make trading as efficient as possible. Many effective trading systems have already been developed based on the TDI indicator and will still be created.