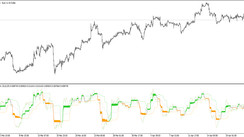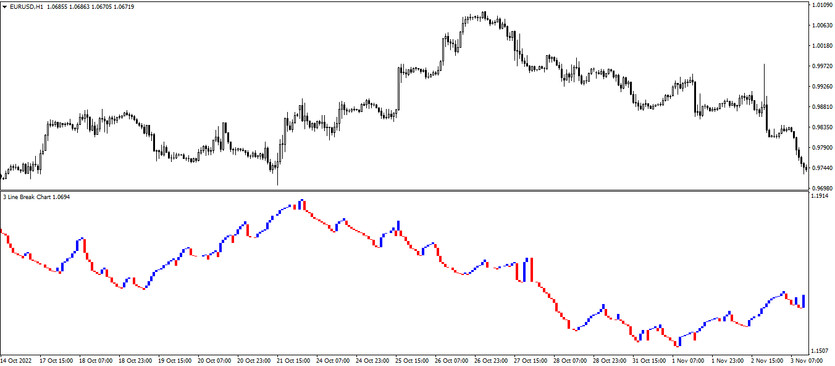
The Three Line Break Chart (TLB) trading indicator is a trading algorithm that is used to trade with the trend, namely, to determine the direction of the current market movement and open trades taking into account the current trend. The indicator is displayed in the lower window of the price chart in the form of bars, which acquire a certain color and form a certain direction depending on the current trend. The values of the current bars formed by the indicator are considered to be its main trading signals.
The Three Line Break Chart indicator is suitable for trading on any timeframe and with any currency pair, as their values do not affect the efficiency of its operation.
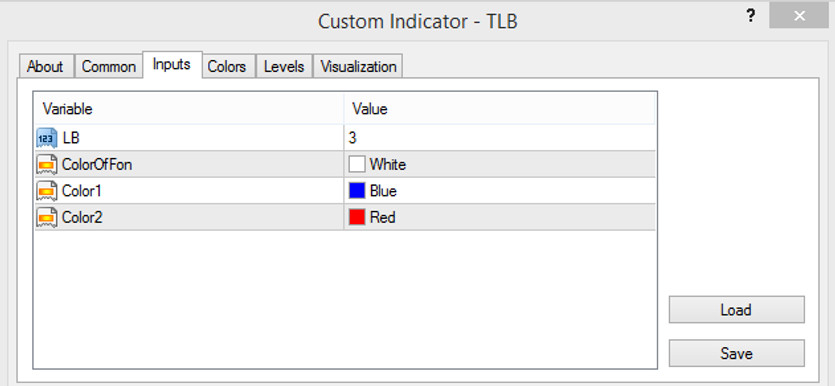
Input parameters
The input parameters of the indicator contained in its settings are responsible for its technical operation, while some of them also affect its general visualization, namely their color scheme.
- LB - value of the calculation period of the Line Break indicator. The default value is 3.
- ColorOfFon - parameter responsible for the background color in the indicator window. The default value is White.
- Color 1 - the color of the bars, which is responsible for the uptrend in the market. The default value is Blue.
- Color 2 - the color of the indicator, which is responsible for the downward movement of the market. The default value is Red.
Indicator signals
The algorithm for applying the Three Line Break Chart indicator in practice is very simple. To use the indicator as a signal tool, it should be take into account the current trend, which is determined by the color and direction of the current bars. After determining the trend, a trade can be opened in its direction. If the trend is up, long positions are opened, while if the trend is down, the positions are short. If the current trend changes, the trades should be closed.
Signal for Buy trades:
- At least three bars of the indicator are colored with the growth value and move up.
Upon receipt of such a condition, a buy trade can be opened on a signal bullish candle. These conditions will characterize an uptrend in the current market. The trade should be closed when the current trend changes, namely at the moment when at least one bar of a different color is formed. At this moment consider opening new trades.
Signal for Sell trades:
- At least three bars of the indicator have a color with a falling value and each one appears below the previous one.
Upon receipt of such conditions, a downtrend is determined in the market, which allows you to open a sell trade. Such a trade should be closed after a bar of a different color forms in the indicator window. At this moment, it should be prepared to open new trades due to a change in the current trend.
Conclusion
The Three Line Break Chart indicator is a very effective and at the same time extremely easy to use trading algorithm. To improve the quality of the indicator signals, it is recommended to use additional indicators, advisers and filters. At the same time, it is also recommended to use a demo account to gain the necessary trading skills and use the indicator correctly.
You may also be interested The Arrows Template Trading Indicator for MT4