
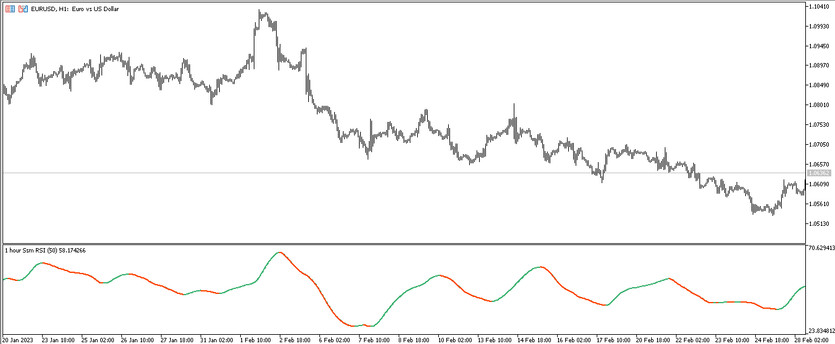
SSM RSI Pivots is a developed trend trading algorithm based on the interaction of accurate and effective indicators. It is used to determine the direction of the current trend in the market and trade in this period directly. For calculations, the indicator uses the calculations of SSM and RSI indicators, which in turn are carefully filtered. The indicator is displayed in the lower window of the price chart as a line, which is painted in a certain color, moving up or down. These line values are considered the main signals of the indicator.
The SSM RSI Pivots indicator works equally effectively on any timeframe, using any currency pair, so their choice is not limited.
Input parameters
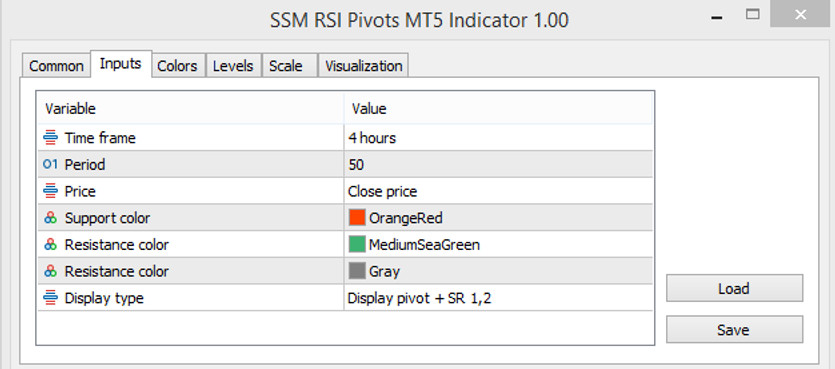
The list of input parameters in the SSM RSI Pivots settings consists of seven items, each of which is directly related to the technical work of the indicator. The Colors section in its settings is used to change the color scheme and line thickness, and the Levels section is used to add signal levels to the indicator window.
- Time frame - the timeframe used for the current trade. The default value is 4 hours.
- Period - value of the indicator period. The default value is 50.
- Price - price to which the indicator's calculations are applied. By default, it is set to Close price.
- Support color - line color responsible for support levels. Default value is OrangeRed.
- Resistance color - resistance level color. Default is MediumSeaGreen.
- Resistance color - another color responsible for resistance levels. Default is Gray.
- Display type - parameter responsible for a specific display of indicator values. By default, it has the value Display pivot+SR 1,2.
Indicator signals
The SSM RSI Pivots indicator is very simple and easy to visualize and therefore suitable even for beginners. Before trading, namely before opening a certain trade, the indicator determines the current trend. To do this, it should be taken into account the color and direction of its line.If the indicator determines an upward trend long positions are opened, if the trend is downward, short positions. Trades should be closed accordingly when the direction of the current trend changes.
Signal for Buy trades:
- The indicator line is colored with the growth value and moves up.
Upon receipt of such conditions that characterize an uptrend in the current market, a buy trade can be opened on a signal candle. It should be closed upon receipt of the opposite conditions from the indicator, namely, when the color and direction of the line change. At this point, it should be considered opening new trades, caused by a change in the current trend.
Signal for Sell trades:
- The indicator line, having turned into a color with a fall value, moves from top to bottom.
A sell trade can be opened immediately upon receipt of such conditions on a signal candle. At this moment, a downtrend is determined in the market. It is recommended to close such a trade when the trend changes, namely when the color and direction of the line change. This, in turn, will allow considering opening new trades.
Conclusion
The SSM RSI Pivots indicator is a very effective, yet extremely easy-to-use algorithm that will suit traders with different levels of experience. Before trading on a real deposit, it is recommended to practice on a demo account to improve trading skills and avoid risks.
You may also be interested The TRIX Pivots trading indicator for MT5


