
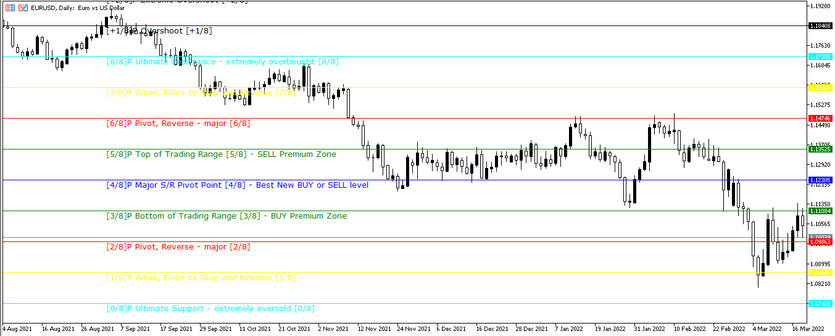
The Murrey Math Lines X indicator, which identifies hidden support and resistance levels, indicates reversal levels. The indicator creates 8 lines on the price chart and there may be additional lines to help identify the best buy or sell points.
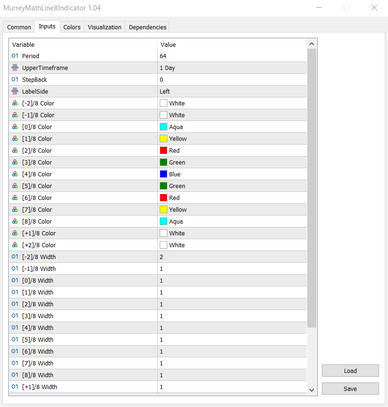
Input parameters
- -Period - a period of a certain time on which the lines will be calculated. The smaller the period value, the less accurate the calculation, but the newer the data. The default value is 64. Set using the UpperTimeframe parameter.
- - MMPeriod-base period, calculated in days. Where the lines are 1440 days, 10080 weeks and 43200 months. If the value is 0, it corresponds to the current value of the period. The default value is daily. Set using the UpperTimeframe parameter.
- -StepBack- shift in the opposite direction to calculate the lines. The default value is 0. Set using the UpperTimeframe parameter.
- -LabelSide-parameter, thanks to which it can be selected the side for displaying labels for lines. The default value is Left. When choosing the value Right, it is necessary to ensure that the graph is shifted to the left, otherwise the labels will not be visible.
- -[N]/8 Color-parameter to select the color of the indicator lines
- -[N]/8 Width - parameter for selecting the width of the indicator lines
- -MarkColor - parameter for selecting the color of the last calculated bar label. The default value is clrBlue.
- -MarkNumber - mark code of the last calculated bar. The default value is 217.
- -FontFace - select a font for displaying fonts. The default value is Veranda.
- -FontSize - the size of the selected font for displaying labels. The default value is 10.
- -ObjectPrefix - prefix for the names of graphical objects for compatibility with other indicators. The default value is MML.
Using this indicator is quite simple, thanks to the lines displayed on the price chart, you can find the optimal point to sell or buy. The strongest support and resistance levels are 0/8P and 8/8P, they are difficult to break. Weak levels are 1/8P and 7/8P, however, a change of direction is also possible. The reversal levels are 2/8P and 6/8P. 3/8P and 5/8P are the bottom and ceiling lines for the average trading range. The main line of support and resistance is 4/8P, when the price crosses this level, you can open certain trades: to buy or sell.
Conclusion
Using the Murrey Math Lines X indicator is much easier than it might seem at first glance. Thanks to the lines, you can easily, quickly and profitably make trades to buy or sell.
But despite the ease of use, for more accurate results and to avoid risks, use a demo account until fully master the indicator.


