
The Curver arrows is a trading indicator that is a special strategy designed to determine the optimal moment to enter the market. The indicator is applied directly to the main window of the price chart and is an arrow system consisting of arrows of different colors and directions, as well as Curves moving, presented as a channel. Thanks to the direction of the arrow, it can be easily understood the current market movement, and the moving ones limit the range of signal candles.
The Curver arrows indicator can be used on any timeframe, with any currency pair. However, it is still not recommended to choose too small and too large timeframes, as well as pairs with extremely low volatility.
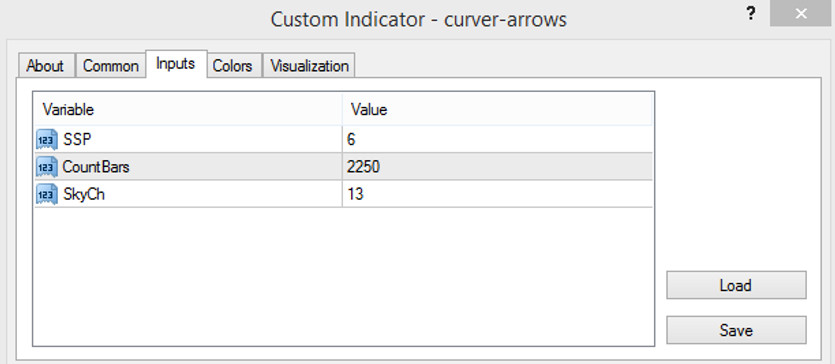
Input parameters
In the settings of the Curver arrows indicator, there are only three input parameters that are responsible for its technical work, there is also a Colors section that is responsible for the color scheme and thickness of the indicator values.
- SSP - parameter responsible for the curve moving smoothing period of the indicator. The default value is 6.
- CountBars - the number of bars that will be covered for the calculation by the indicator. The default value is 2250.
- SkyCh - parameter responsible for the distance of moving averages in relation to the price chart. The default value is 13.
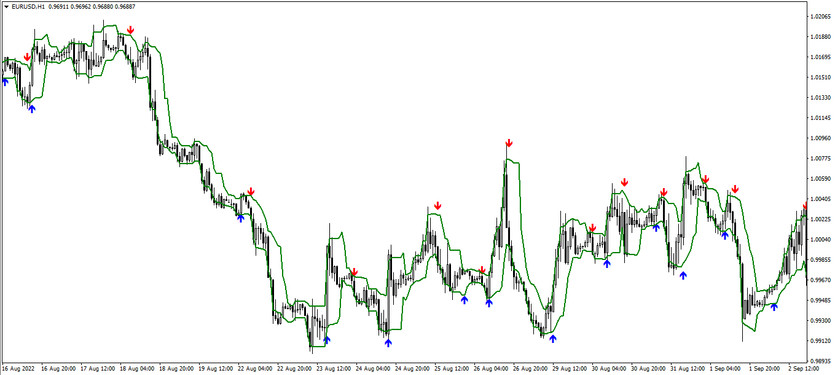
Indicator signals
Despite the presence of moving averages on the chart, the Curver arrows indicator works on the principle of all arrows. That is, the indicator generates a signal to enter the market when a certain arrow appears on the chart, which in turn has its own color and direction. However, the appearance of an arrow on the chart directly depends on the location of the price relative to the moving average channel. If the price is inside it, then another arrow appears and a position can be opened in a certain direction.
Signal for Buy trades:
- The signal candle is located inside the channel of the moving curves.
- After that, under this candle an arrow is formed, colored in color with the value of growth, directed upwards.
When such an arrow appears on the chart, a buy trade can be opened. Such a trade should be closed after a new arrow appears on the chart, which makes it possible to open a new position.
Signal for Sell trades:
- The candle should be between two moving curves.
- An arrow should appear above this candle, having the color of falling and pointing down.
After the appearance of such a condition, a short position can be opened on a certain candle. It should be closed as soon as a new arrow appears on the chart, which will signal the possibility of opening new positions.
Conclusion
The Curver arrows indicator is very logical and extremely easy to use, so it is perfect for use by beginners. It should be borne in mind that the indicator will bring better results when it used in trading strategies or with additional tools. Also, to be able to accurately use the indicator, it is recommended to practice on a demo account .


