The Slope Direction Line indicator is a specialized algorithm that is based on the same principle as the time-tested Moving Average tool. Both algorithms operate according to similar rules and have similar settings.
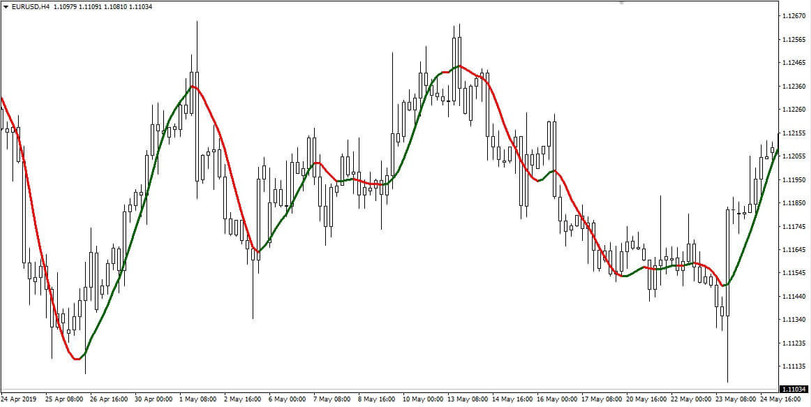
A distinctive feature of this algorithm is that its curve changes its hue at the moment when the trend changes on the chart. This algorithm is displayed on the trading chart in the form of a colored curve, which is located near the price.
In a situation where the price begins to move in the opposite direction, the curve of the algorithm also changes its color. Thanks to this function, you can quickly receive information about changing trends in markets that are characterized by spasmodic price movements.
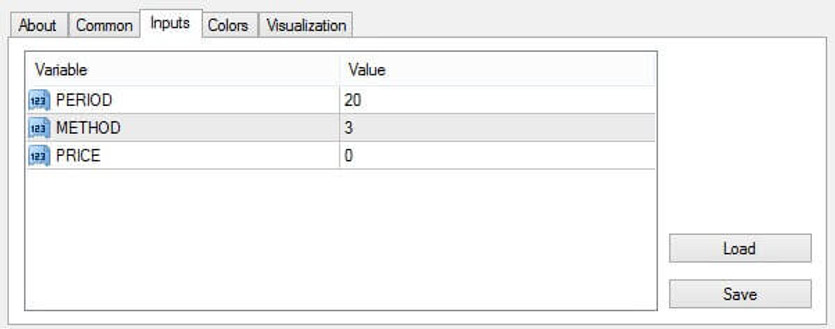
Indicator settings
PERIOD. This parameter corresponds to the period of the curve of the algorithm.
METHOD. This parameter corresponds to the type of moving average that will be displayed on the screen. You can enter the following numbers to get the 4 different types of moving averages:
- enter 0 = a simple moving average will be applied;
- enter 1 = exponential moving average;
- enter 2 = smoothed moving average;
- enter 4 = linear weighted moving average;
PRICE. This parameter is responsible for the type of price that will be involved in all calculations. If you enter a value of 0 in this field, the price level of closure will be applied, if you enter the number 1, then closures, and if you enter 2 in this field, then the maximum value of the price level. In order for the algorithm to apply the minimum value of the price level, it is necessary to enter a value of 3 in this field.
Indicator signals
This indicator is similar to the usual Moving Average. Therefore, it is recommended to use it to quickly identify trends in the market. If it is correctly applied, then the trader will have the opportunity to open orders in the direction of the main price movement. Slope Direction Line has the same strengths as the moving average. Due to this feature, the algorithm is perfect for determining suitable moments for opening and closing profitable positions.
The indicator line, depending on the current situation, is displayed in two colors: red and green.
Changing the color of the line from red to green indicates a possible increase in the asset. When the line changes its color from green to red, this is a sign that the asset is declining.
Conclusion
Despite all the obvious advantages of this algorithm, experienced traders urge to use it as an element of a trading technique. Slope Direction Line with other algorithms makes it possible to make the trading process more secure.
Download the Slope Direction Line indicator for MetaTrader 4 from the button below
Tip: Can’t open the downloaded archive file (ZIP or RAR)?
Try WinRAR for Windows or The Unarchiver for Mac .
Do you need help with installing this indicator into MT4 for Windows or Mac OS? Our guide HERE will help you.