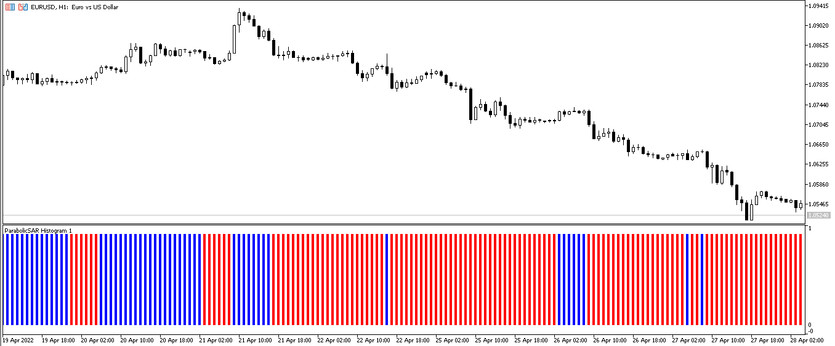
The Parabolic SAR Histogram is a modification version of the classic Forex indicator Parabolic SAR. Now on the price chart, instead of dots, the indicator will display a histogram, with which it can be quickly determined the trend and identified the optimal entry points for trades. Due to the presence of two colors in the histogram, the trend can be easily and quickly determined.
The indicator is very simple in the technique of its work, so even beginners can use it. The indicator is used with any currency pairs, with any timeframes.
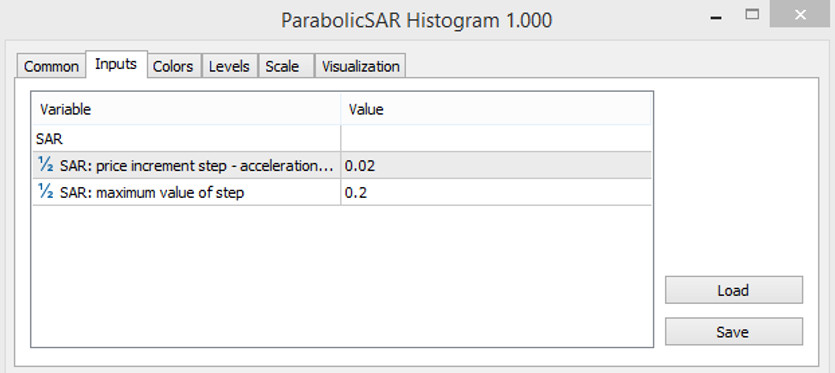
Input parameters
Despite the change in the visualization of the Parabolic SAR indicator, the Parabolic SAR Histogram has almost the same input parameters and its calculation has an identical scheme.
- -SAR: price increment step: price increment step of the price increase that performs the calculations. Default is 0.02.
- -SAR: maximum value of step - the maximum value of the indicator step. The default value is 0.2.
Since the histogram is painted in the default color, it can be changed in the indicator settings, as well as the width.
Indicator signals
It is easy to guess that by changing the color of the histogram, the market trend will be determined. A color with an increase value will characterize an uptrend, and a color with a fall value will characterize a downtrend. And due to the trend determined by the indicator, the direction of the trade will be chosen.
Signals for Buy tardes:
- -In the market, an uptrend was determined by changing the color of the histogram.
- -At least three columns of the indicator are colored with a growth value, which characterizes the stability of the trend.
With such a correspondence, a long position can be opened, which should be closed when the histogram color changes, that is, when a downtrend is determined.
Signals for Sell trades:
- - The histogram is colored with a falling value, which characterizes the beginning of a downtrend.
- -At least three bars of the histogram have a falling value.
A short position is opened on the candle on which these conditions coincided. The trade should be closed when the histogram color changes, this is a signal of the end of a downtrend and the beginning of an uptrend.
Conclusion
The Parabolic SAR Histogram is an indicator that is great for fast and efficient trading while identifying a trend in the market. Due to the fact that the indicator is easy to use, it can be used even by beginners. But despite the fact that the Parabolic SAR Histogram is an improved version of the classic indicator, the presence of false signals cannot be ruled out. Therefore, in order to be completely confident in the profitability of trading, it should be used additional indicators and practiced on a demo account.