OsMA indicator is not the most popular technical tool of all that are included in the basic package of indicators. Nevertheless, it has its advantages, and in some cases, OsMA works more efficiently than any other oscillator.
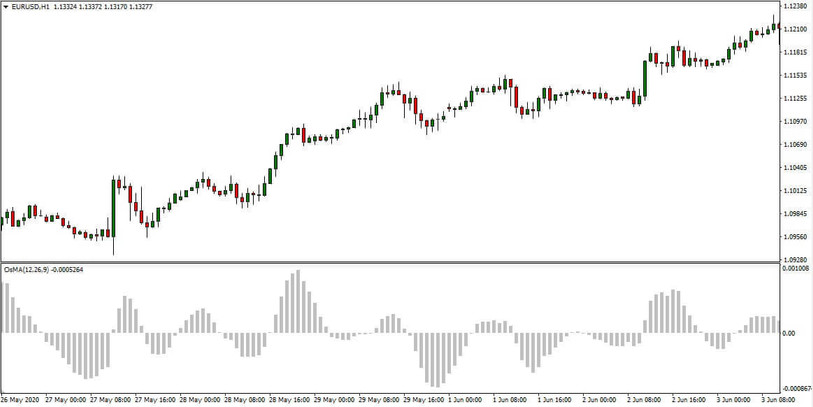
The OsMA indicator is an oscillator that is based on the readings of another, more popular oscillator - MACD. OsMA shows the discrepancy between the MACD curve and its histogram. The moment of the intersection of the histogram and the line is the OsMA zero mark. If the MACD histogram rises above the line, then the OsMA histogram rises above the zero marks. In the opposite situation, OsMA shows negative values.
OsMA is a more narrowly targeted indicator than MACD. Given the degree of the relativity of the readings of its histogram, the strongest signal of this instrument is divergence.
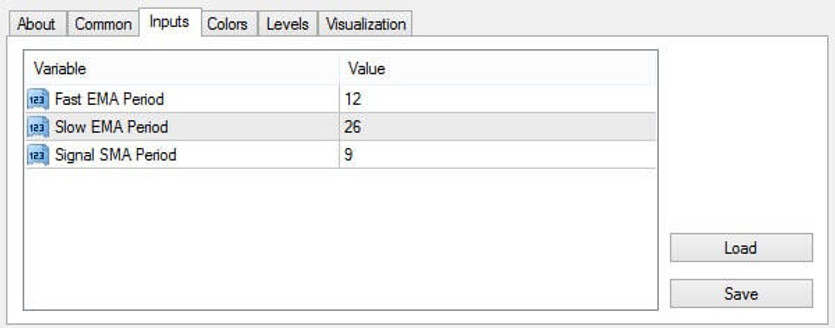
Indicator settings
OsMA indicator has the same settings as the MACD:
- Fast EMA is the first exponential MA, with a shorter period. Her discrepancy with the second EMA and tracks MACD.
- Slow EMA is the second moving average with a large period.
- Signal SMA is a simple moving average that is built on the basis of differences between the two exponentials. The SMA period shows how much the EMA discrepancy will be averaged.
In most trading strategies, OsMA is used with standard parameters. After the setup is completed and the indicator is set on the chart, you can begin to analyze and open deals.
Indicator signals
As noted earlier, the main signal of the OsMA indicator is divergence. Divergence (discrepancies in the direction of the dynamics of the price chart and the histogram of the indicator) is one of the strongest signals. In addition, divergence is considered a leading signal. If you enter the market by divergence, confirmed by other signals, you can "catch" the trend at the very beginning and get the maximum profit.
To determine divergence, it is necessary to connect at least the last two extremes on the price chart and the histogram of the indicator. If the lines formed by these peaks or troughs are directed in different directions, then divergence is present.
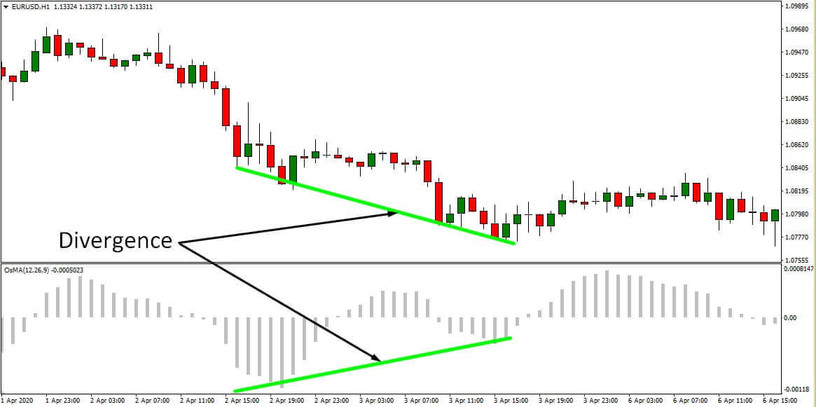
In a pair, the indicator graph is played by the leading role OsMA. Therefore, deals are opened in the direction that the line connecting the extremes on the indicator indicates:
- If the line is directed upwards, buy deals are opened.
- If the line is directed down, sell deals are opened.
In addition to divergence, a signal to open a deal is considered to be the intersection of the zero marks with a histogram. However, this signal is often false and leads to losing trades. In addition, it completely repeats the simple MACD histogram crossing of the moving average of this indicator. Therefore, it is recommended to use only divergences in OsMA signals, and in conjunction with the signals of other indicators.
Conclusion
Despite the small popularity of this indicator, its leading signals in finding divergence are no worse than the famous MACD. In some trading strategies, OsMA is the preferred tool. Use this indicator in combination with other filters to get more accurate signals. Examples of strategies using the OsMA indicator can be found on our website in the Strategies section.
Download the OsMA MT4 Indicator from the button below
Tip: Can’t open the downloaded archive file (ZIP or RAR)?
Try WinRAR for Windows or The Unarchiver for Mac .
Do you need help with installing this indicator into MT4 for Windows or Mac OS? Our guide HERE will help you.