The On Balance Volume indicator is one of the first Volume Spread Analysis tools, which analyzes price movements in conjunction with trading volumes. OBV creator Joe Granville gained fame in the stock market for accurate forecasts published in his newsletter and books on technical analysis, describing the indicator formula.
The author of the indicator suggested taking into account the volume of the available trading history, thereby creating a complete picture of the market. The role of price in the OBV formula was reduced to determining the sign in front of the trading turnover figure. The day's negative close defined the trading volume as a negative number, while the rising daily candle kept its positive value.
Indicator calculations
Joseph Granville described daily trading results as an infinite number of positive numbers for a candle that closed above the opening, and negative numbers if at the end of the day the price was below the session's opening level. Further, the author constantly summarized the results obtained:
OBV = ∑ k * Volume,
The coefficient k determined the +/- sign based on the candlestick closing price position.
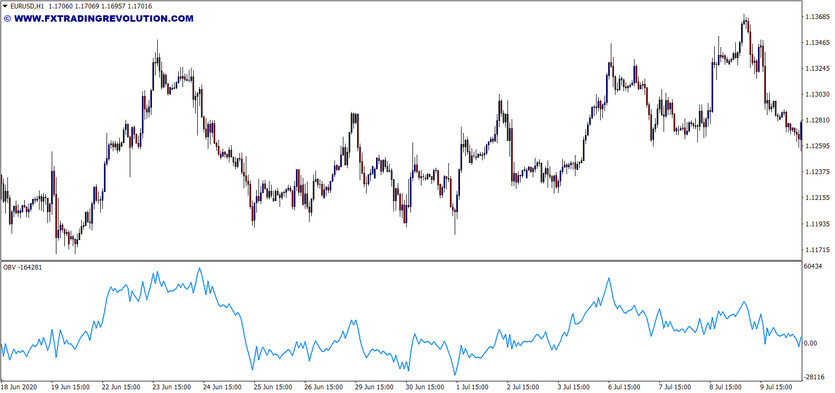
As you can see from the formula, the indicator curve can take positive and negative values during protracted trends, indicating the global market trend at the current moment. OBV does not have a period, applying a "through" summation showing the cumulative volume value.
A regular histogram of volumes can grow in the event of a fall or rise in the rate, making it difficult to find divergence signals when traders' activity does not confirm the trend. The OBV correlation with the chart instantly displays the market picture, visually confirming or refuting both types of a price trend.
This quality becomes especially important in the most difficult trading areas - flat, where uncertainty brings the most losses to the trader. Volume analysis allows you to identify hidden movement and correctly predict the trend.
Indicator signals
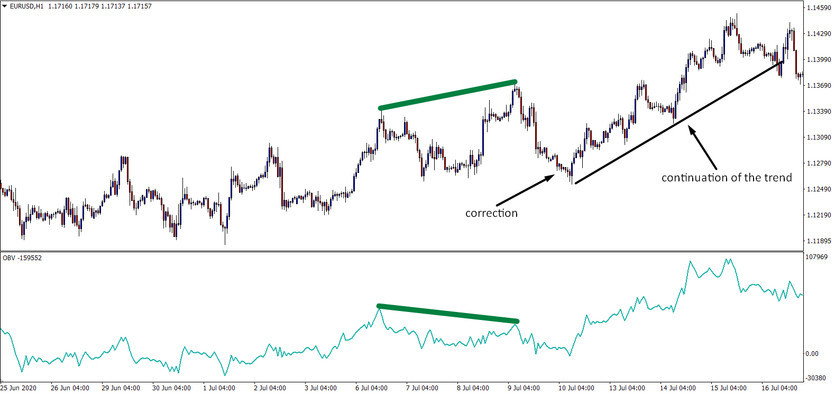
OBV divergences are one of the most widely noted signals by analysts. But this divergence is different from other similar price and indicator divergences. It means that an upward or downward trend in quotes, not confirmed by highs or lows of On Balance Volume, is interpreted as an upcoming price correction. High volumes should show that traders are ready to continue buying, but soon the downtrend ends with a big fall. High On Balance Volume on a downtrend leads to a sharp dip in the rate. This proves that all OBV divergences confirm the high probability of the current price trend.
Counter-trend signals on a trading indicator give support and resistance lines, which are determined according to principles similar to graphical price analysis:
A BUY trade is opened after the appearance of a double bottom if OBV showed a fall before;
A SELL trade is opened after the second top, formed at the end of an uptrend.
Conclusion
The accumulative system of OBV volumes multiplied by positive and negative coefficients greatly simplifies the analysis of price fluctuations while maintaining the direction of the trend coinciding with the market. The indicator is recommended for beginners who are starting to work with VSA theory or have difficulty in determining the direction of the current movement of an asset.