Trend indicators are especially popular in all financial markets as they help to quickly recognize the price movement vector. On Forex, this topic is especially relevant, so such a valuable trending specimen like NeuroTrend certainly deserves attention.
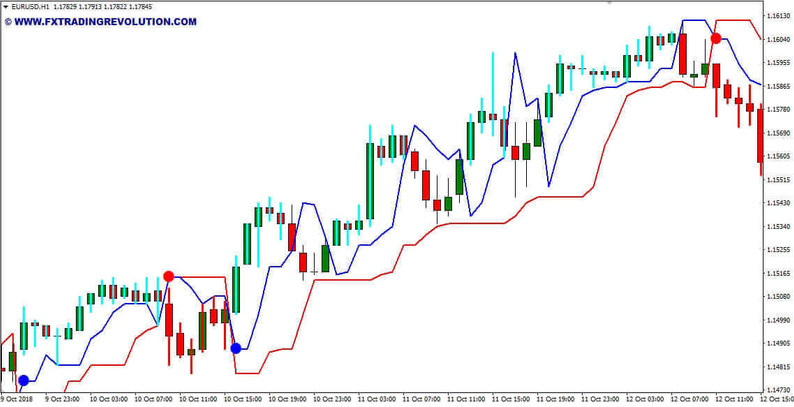
The NeuroTrend indicator placed on a chart in MT4
The picture above shows the visual markup of this indicator. As you can see, in addition to the markings on the candlesticks, this indicator draws two colored lines - red and blue, along which the trend is determined, in particular, a bearish formation is formed if the price rapidly breaks through the local minimum, after which it stably keeps below the current highs.
Within the framework of the NeuroTrend algorithm, local extremum are tracked in dynamics, i.e., for a certain time interval specified by the user. For example, if the Z field is set to 20, the indicator will draw a red line through the maximum price that has formed over the last 20 candles.
Then, as new candles appear, the counting will begin to change, since earlier local highs are excluded from the calculations, and new extremes come in their place.
NeuroTrend will keep the bearish counting in effect as long as the price is below its key line. The converse is also true: as soon as a quote breaks the red bar upwards and consolidates above it, we can say that the market sentiment has changed to bullish.
In the case of an uptrend, the counting is built in the same way, only now the formula will start tracking the dynamics of the minimums, which are constantly updated as new primary data appears.
Indicator settings
The value of the Z parameter can be changed at your discretion (the farther the forecasting horizon, the more candles you need to study);
It is better to always leave the Z1 value equal to one (in fact, it does not affect the results of calculations and is only responsible for shifting the blue line along the X-axis, which is absolutely inappropriate);
It is advisable to always leave the values of the "S" and "S1" functions at zero since they are responsible for shifting the red line along the price scale (practice has shown that such experiments almost always degrade the quality of the markup and lead to errors).
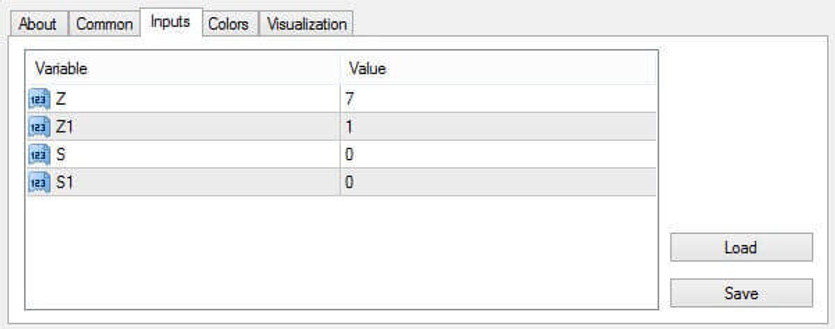
NeuroTrend indicator -Settings in MT4
Indicator signals
Despite the fact that the considered indicator belongs to the category of the simplest algorithms, it can be used to find a lot of high-quality signals. Depending on the settings of the parameters and timeframes on which NeuroTrend is applied, the following signals can be distinguished:
The red line of the indicator can serve as a moving average. If the price is above this line, it is a bull market. If the price is below the red line of the indicator, it is a bear market in which selling should be considered.
In addition, the red and blue points of the indicator serve as additional signal filters. Blue dots indicate the likelihood of growth, and red dots indicate the probability of a decrease.
Conclusion
Applying the NeuroTrend indicator in practice and comparing it with other popular trend indicators, even without relevant in-depth research, it becomes obvious that it is much more effective than moving averages, since it operates with real extremums, and not averaged values.
Tip: Can’t open the downloaded archive file (ZIP or RAR)?
Try WinRAR for Windows or The Unarchiver for Mac .
Do you need help with installing this indicator into MT4 for Windows or Mac OS? Our guide HERE will help you.