Many indicators currently used in technical analysis on the Forex market were originally developed for completely different purposes. Many production cycles, engineering processes required a scientific, mathematical approach that would allow us to find patterns and build mathematical models on their basis. The found patterns were transformed into algorithms, which were then turned into programs to automate the process or solve more complex problems. But everything is always interconnected. An example is a Fibonacci sequence, applicable to the proportions of a person or plants, and to trading.
Entropy is a measure of disorder, a term used for the most part in physics. In simple words: the level of entropy is determined by the degree of uniformity of the distribution of something (for example, matter) in space. If the salt with the water lay in a cube, the entropy of the state is small, and if it is dissolved and distributed evenly throughout the glass, then it is large. How to measure the state of the chaos? The question is rhetorical. Indeed, the greater the entropy, the greater the number of variations of permutations in it is possible. A cube of salt in water can be located in only a few positions and a dissolved cube in as many as you like. There is something similar in the market.
The concept of entropy is associated with chaos, where there are billions of possible variations. But this does not mean at all that it is impossible to find a pattern in it. The starry sky can be called high entropy, but nevertheless, there are constellations in it. The Entropy Math indicator looks for patterns on the basis of which a trading strategy is built.
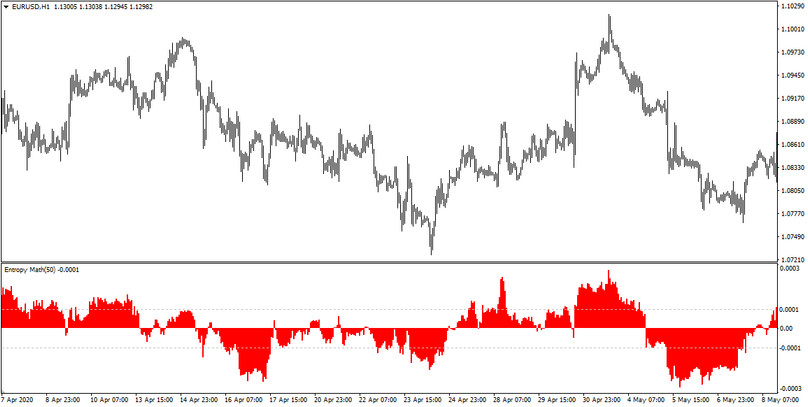
Visually, this tool looks like a histogram displayed in a separate window under the price chart. The histogram reference point is the zero line in the indicator window. The method of its construction is determined depending on the values of the input parameters specified in the settings.
Indicator Settings
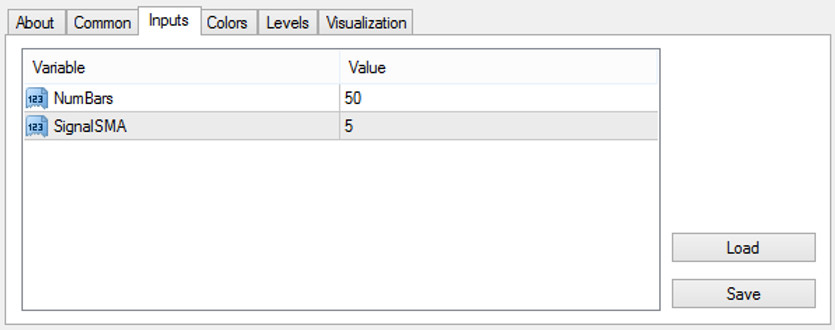
The Entropy Math indicator has the following parameter settings:
The NumBars is the parameter responsible for the number of bars for calculating the histogram. The higher this value is set, the more accurate the signals can be obtained.
The SignalSMA is a parameter whose value is responsible for the averaging period of the moving average used to calculate the histogram of the indicator.
Indicator signals
The exit of histogram bars beyond the level of 0.0001 is traditionally considered an overbought zone, and values below -0.0001 are an oversold zone.
In addition, the Entropy tool is well suited to detect divergence in the market.
Conclusion
Using this indicator as part of the system, along with other methods of determining and receiving signals, you can achieve good trading results. Examples of ready-made strategies in which this tool is used are available in the Strategies section of our website.

