The Dots indicator is formed on the basis of a function that is used to obtain the direction of the price momentum and the current trend in the market, using the cosine of the angle. Dots places points on the price chart that are not redrawn.
The indicator determines entry or exit points when making trades on the market with great accuracy. It can also be used in various Forex systems as an additional indicator. It is available on the MT4 platform. It is used on any convenient time interval using any currency pair.\
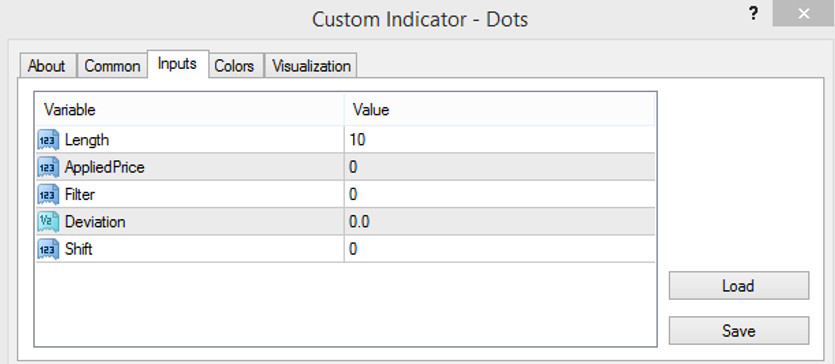
Input parameters
- -Length - defines the time period of the indicator required for calculation. The default value is 10. The larger the value, the greater the time delay, but the fewer false signals.
- -AppliedPrice - parameter to use the price in calculations. With it, you can specify the opening, closing, minimum or maximum price of the candle. The default value is 0.
- -Filter - a unique parameter for adjusting the price filter without display delays. The default value is 0.
- -Deviation-parameter to change the direction of the indicator vertically. The default value is 0.
- -Shift- parameter to change the direction of the indicator horizontally. The default value is 0.
Trading with the Dots indicator
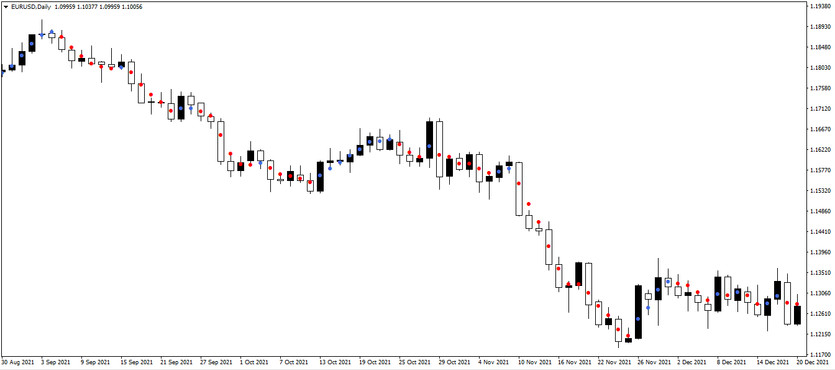
The mechanism of operation of this indicator is quite simple. Analyzing the slope of the moving averages and taking into account the opening or closing prices of candles, it places dots of two colors on the chart. Points with a value up determine an uptrend, and points with a value down determine a downward trend.
Accordingly, a change in the color of the points is the main signal of this indicator. If points with a value up change to points with a value down, a sell entry is made into the market, and in the same way, buy trades are exited. And if, on the contrary, points with a value down are replaced by points with a value up, a buy entry is made into the market, the exit from sell trades is also performed. Two adjacent dots of the same color can be considered as a signal to open a trade. When entering the market, a stop-loss order is placed below the entry candle, and when exiting the market, at the resistance above the entry candle.
Conclusion
The use of the Dots indicator is very simple, but it is worth considering the possible occurrence of false signals. During a trend in the market, Dots determines accurate and stable signals. But during a flat period, Dots often gives false signals, so it is recommended to use it in combination with indicators that determine the trend in the market.