
The BB RSI Signal indicator was created to determine the optimal points for opening positions by sending a signal. The indicator is calculated by the interaction of the Bollinger Bands and RSI indicators. After their joint calculations, an icon appears on a certain candle, the color of which will determine the direction of the trade. The indicator is applied on a price chart with any timeframe and using any currency pair.
Input parameters
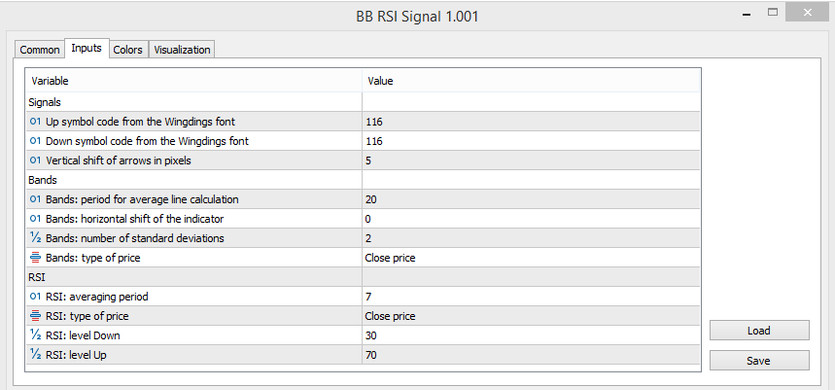
Since the BB RSI Signal indicator is a kind of system consisting of two indicators, each indicator included in it will be configured separately. That is, in the indicator settings there are parameters for both indicators that can be changed at any time.
Signals
- -Up symbol code from Windings font - code parameter that has the property of changing the symbol with the up value. The default value is 116.
- -Down symbol code from Windings font - symbol rendering code with down value. Default value is 116.
- -Vertical shift of arrows in pixels - vertical deviation of the symbol from the price chart, measured in pixels. The default value is 5.
Bands
- -Period for average line calculation - the value of the period of the average line of the BB indicator, which performs the calculation. The default value is 20.
- -Horizontal shift of the indicator - horizontal deviation of the indicator from the price chart. The default value is 0.
- -Number of standard deviations - the number of standard deviations. The default value is 2.
- -Type of price - type of price to which the indicator calculations will be applied. The default value is Close price.
RSI
- -Averaging period - the period for calculating the average line of the indicator. The default value is 7.
- -Type of price - type of price to which the calculation of the RSI indicator will be applied. The default value is Close price.
- -Level Down - the lower level of the RSI indicator, indicating the oversold zone. The default value is 30.
- -Level Up - the level of the indicator, at the intersection of which overbought is observed. The default value is 70.
In the settings, the width and color scheme of the indicator can also be changed.
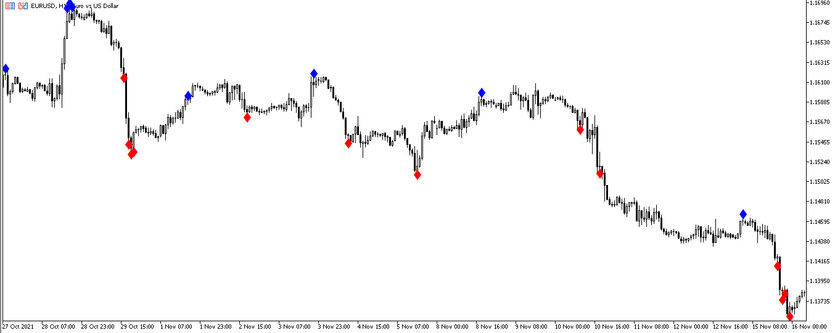
Indicator signals
Despite the fact that the standard BB and RSI Signal indicators do not appear on the chart, their calculations are taken into account when placing a symbol. After a perfect calculation, a symbol is formed on a candlestick on which all the necessary conditions matched. And only then a signal appears and a certain position is opened. And accordingly, the appearance of a new symbol on the chart will be considered an indicator signal.
Signals for Buy trades:
- - A symbol has formed on the chart that has a growth value. It must be above a certain candle.
But before the appearance of this symbol, the following conditions must be formed:
- -The candle is above the upper line of the Bollinger Bands indicator.
- - The RSI indicator breaks through the 70 level, indicating overbought.
When making a buy trade, stop loss should be set at the point of a recent local minimum.
Signals for Sell trades:
- -On the price chart, namely, a symbol with a fall value has formed under the candles.
The appearance of this symbol is preceded by a combination of the following conditions:
- -Candle opened below the Bollinger Bands indicator.
- - The RSI indicator breaks through the 30 level, indicating overbought.
When making a sell trade, stop loss should be set at the point of a recent local maximum.
Conclusion
The BB RSI Signal is a very handy indicator, as it indicates trade entry points on its own. The combination of effective standard indicators forms a new and much improved indicator. BB RSI Signal is also great for using in various strategies, as its signals are most often accurate. And if it is taken the time to practice on a demo account, the desired results can be achieved.


