
There is a lot of emphasis on technical indicators when it comes to trading using technical analysis. That is because they provide great insight into what is happening in any market. In short, they work. But they are not for everybody. Some traders enjoy trading using a chart devoid of indicators. They read each candle of price action and interpret them in their own right.
Why Not Use Indicators?
Many traders start out very excited about technical indicators. You can get buy and sell signals from any chart without even needing to understand what’s really happening. This can be particularly appealing for beginning traders, who don’t have a lot of experience to leverage. However, there are so many indicators these days that it can be easy to experience technical indicator overload.
Many Indicators Only Work In Certain Conditions
Many indicators only work in certain conditions.
The Parabolic SAR, for instance, is only relevant in trending markets. If you tried to use its bearish and bullish signals in a ranging market, it would likely negatively impact your account.
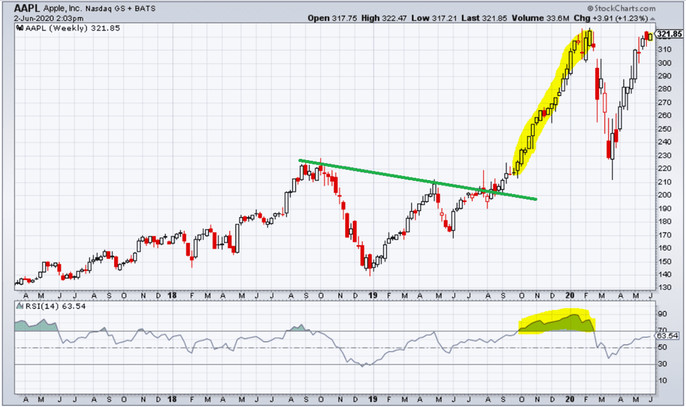
The Relative Strength Index (RSI) generates overbought and oversold signals. An overbought RSI is generally interpreted as a sell signal, while an oversold RSI is usually considered a buy signal. But if you’ve had any experience with the RSI, you will have noticed that there are many times when the RSI shows overbought and they would be terrible times to sell.
Strong trends often show as overbought on the RSI, as shown in the chart below. Look at the price move we would have missed if we used the RSI as a sell signal.
Of course, nobody should do that even if they are using technical indicators. But this illustrates how dependent the RSI is on market conditions and upon other indicators to tell us that.
To summarize, these technical indicators do not work by themselves. They must be understood and interpreted both individually and in the light of the type of market you are analyzing and in the light of other indicators. For example, if you rely on an indicator to tell you if a market is trending, you will need that indicator to tell you that the Parabolic SAR can be used.
Indicators Distract From The Price Chart Itself
If indicators conflict with each other and if you are dependent upon other indicators to learn how to use them, that is a lot to learn. If you’re going to be spending a lot of time learning, why not just learn price action itself. Instead of understanding what each indicator is telling you, why not learn from the price action itself what kind of market you are in, whether the market is trending or ranging and many other aspects of technical analysis.
Trading Without Indicators
Candlesticks and being able to read candle patterns allow you to see how the battle between buyers and sellers is playing out. By identifying particular candle patterns, you can identify what is going on in any market. You can also draw trendlines, along with support and resistance to identify these important areas of the price action.
As you can see from the resistance level above drawn from the two failed peaks, you could enter at the break of resistance and set your stop loss below the resistance level and gained over $100 per share on a long-term trade.


