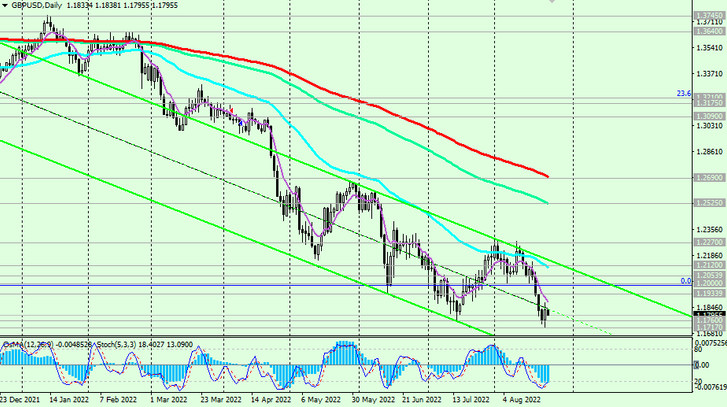
Despite yesterday's upward correction, GBP/USD may soon break yesterday's local low since April 2020 at 1.1717, heading towards multi-year record lows below 1.1500, reached in March 2020, when the world's largest central banks, including the Bank of England, sharply reduced their interest rates, also launching unprecedented programs to support the population and businesses during the start of the coronavirus pandemic.
Below key resistance levels 1.2525 (EMA144 on the daily chart), 1.2690 (EMA200 on the daily chart) GBP/USD remains in the long-term bearish market zone.
Thus, the breakdown of local lows at 1.1760, 1.1717 will be a signal to resume short positions in GBP/USD.
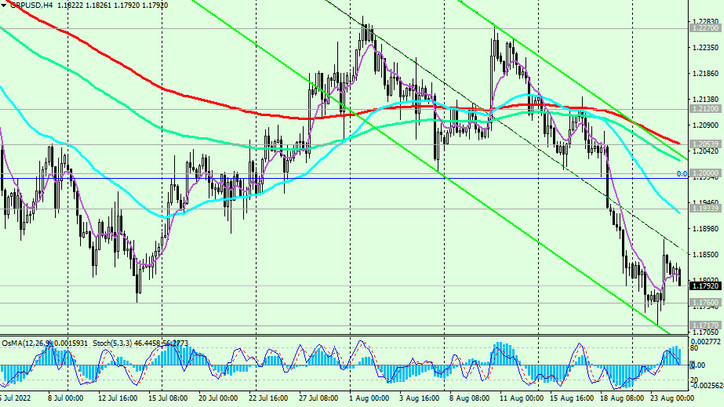
In an alternative scenario, a breakdown of the important short-term resistance level 1.1934 (EMA200 on the 1-hour chart) will signal the resumption of an upward correction with targets at resistance levels 1.2000, 1.2054 (EMA200 on the 4-hour chart), 1.2120 (EMA50 on the daily chart). Further growth looks unlikely so far.
Support levels: 1.1760, 1.1717, 1.1500, 1.1410
Resistance levels: 1.1934, 1.2000, 1.2054, 1.2120, 1.2270, 1.2525, 1.2690
Trading recommendations
Sell Stop 1.1780. Stop Loss 1.1885. Take-Profit 1.1760, 1.1717, 1.1600, 1.1500, 1.1410
Buy Stop 1.1885. Stop Loss 1.1780. Take-Profit 1.1934, 1.2000, 1.2054, 1.2120, 1.2270, 1.2525, 1.2690