
As you can see from the daily and weekly charts of the S&P 500, the price has come close to the strong resistance level 4180.0 (EMA200 and the upper line of the rising channel on the daily chart, EMA50 on the weekly chart).
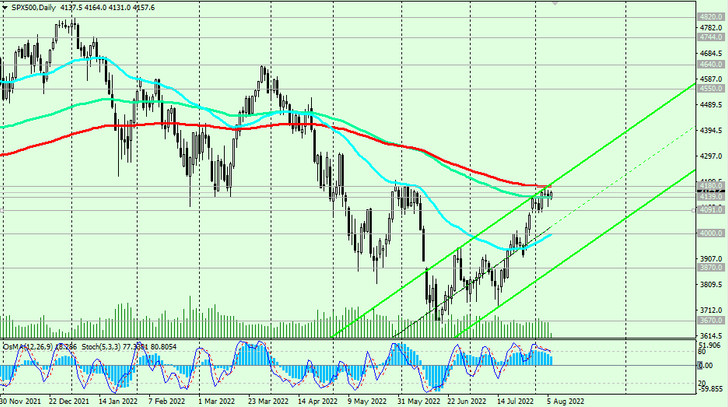
Considering the multi-year bullish trend of the S&P 500, a break of this matching level will signal the end of the downward correction and the resumption of the bullish trend.
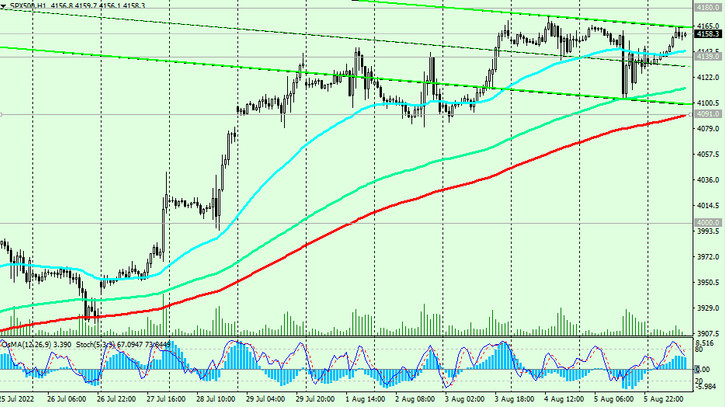
In an alternative scenario, and after the breakdown of the support level 4091.00 (EMA200 on the 1-hour chart), the S&P 500 will return inside the descending channel on the weekly chart and head back to the key long-term support level 3670.00 (EMA200 on the weekly chart). Its breakdown could finally break the long-term global bullish trend of the S&P 500.
Support levels: 4139.00, 4091.00, 4000.0, 3870.00, 3670.00, 3600.00
Resistance levels: 4180.00, 4550.00, 4630.00, 4820.00
Trading recommendations
Sell Stop 4075.00.00. Stop Loss 4185.00. Targets 4000.0, 3870.00, 3670.00, 3600.00
Buy Stop 4185.00. Stop Loss 4075.00. Targets 4200.00, 4300.00, 4400.00, 4550.00, 4630.00, 4820.00