

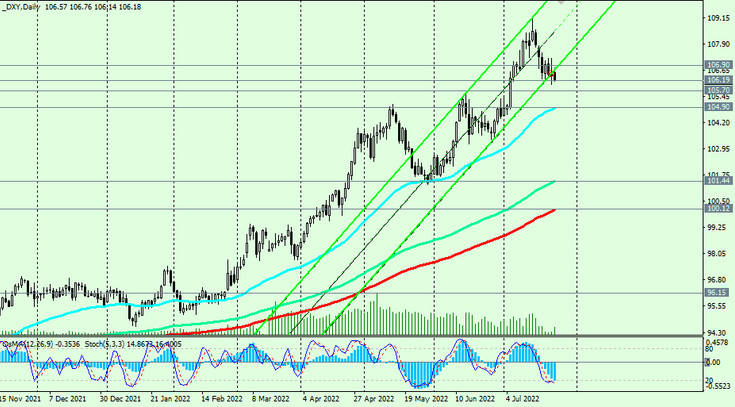
At the time of writing this article, DXY futures are traded near 106.19 and EMA144 support on the 4-hour chart. If the downward correction of the dollar continues, then after the breakdown of the important support level 105.70 (EMA200 on the 4-hour chart), DXY will fall to the medium-term support level 104.90 (EMA50 on the daily chart).
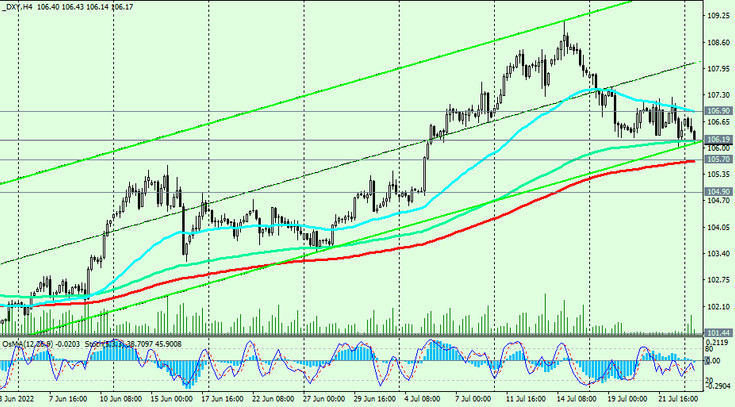
However, as we wrote above, “given the strong bullish momentum and the long-term DXY uptrend”, it is logical to place pending buy orders near the support levels 105.70, 105.00, 104.90.
A signal for opening long positions will also be a breakdown of the short-term resistance level 106.90 (EMA200 on the 1-hour chart). “Signals for building up long positions on the DXY dollar index may also come when the resistance levels 107.50, 108.00 are broken. The breakdown of the local resistance level 109.00 will be a signal to increase long positions in DXY futures "with the prospect of growth towards multi-year highs of 121.29 and 129.05, reached, respectively, in June 2001 and November 1985."
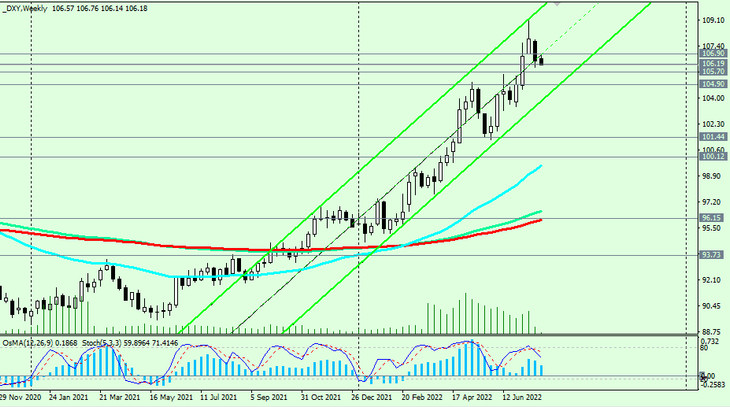
Support levels: 106.19, 106.00, 105.70, 105.00, 104.90, 104.00, 103.75, 103.00, 102.00, 101.44, 100.12, 100.00
Resistance levels: 106.90, 107.50, 108.00, 109.00
Trading Recommendations
Sell Stop 105.60. Stop Loss 107.10. Take-Profit 105.00, 104.90, 104.00, 103.75, 103.00, 102.00, 101.44, 100.12, 100.00
Buy Stop 107.10. Stop Loss 105.60. Take Profit 108.00, 109.00, 110.00, 111.00
Buy Limit 105.70, 105.10. Stop Loss 104.70. Take-Profit 106.00, 107.00, 108.00, 109.00, 110.00, 111.00


