
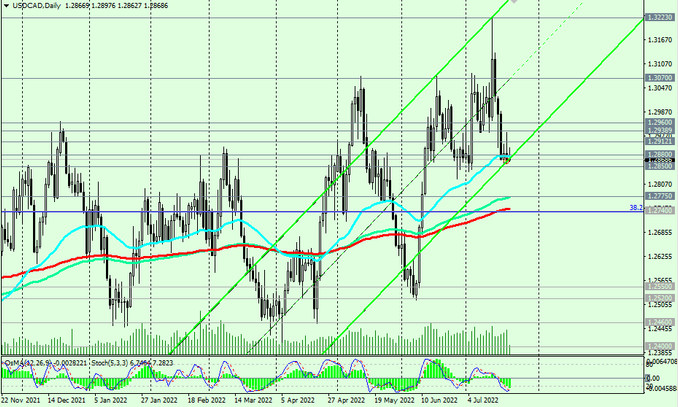
At the time of publication of this article, USD/CAD is traded near the level 1.2868, remaining in the bull market zone - above the key support levels 1.2850 EMA200 on the weekly chart, 1.2775 (EMA144 on the daily chart), 1.2740 (EMA200 on the daily chart and the Fibonacci level 38.2 % of downward correction in the USD/CAD growth wave from the level of 0.9700 to the level of 1.4600).
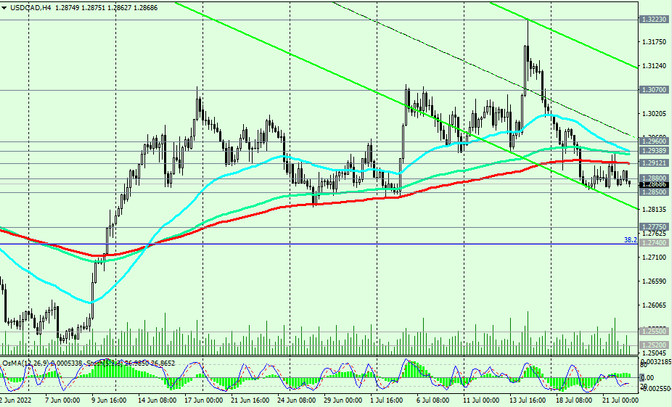
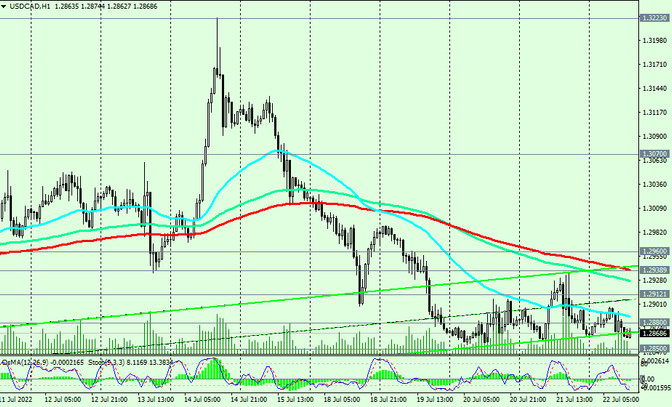
However, important short-term support levels 1.2938 (EMA200 on the 1-hour chart), 1.2912 (EMA200 on the 4-hour chart), 1.2880 (EMA50 on the daily chart) are broken, which indicates the development of a downward correction, which may last up to the support levels of 1.2775, 1.2740 (with a successful combination of factors).
In this case, a breakdown of the support level 1.2850 may become a signal for USD/CAD sales.
In an alternative scenario, a breakout of the resistance levels 1.2880, 1.2917 will be the first signal to resume long positions, and a breakout of the resistance levels 1.2938, 1.2960 - a confirmation.
USD/CAD maintains positive dynamics, remaining in the bull market zone, above the key support levels 1.2550, 1.2740, 1.2850.
And today at 12:30, 13:45 (GMT) an increase in volatility is expected in USD, CAD quotes and, accordingly, in USD/CAD.
At 12:30 Statistics Canada will publish a monthly report with data on retail sales. The retail sales index is often considered an indicator of consumer confidence and reflects the state of the retail sector in the near term. The growth of the index is usually a positive factor for the CAD; a decrease in the indicator will negatively affect the CAD. According to the forecast, the index is expected to grow by +1.6% in May after +0.9% in April, which should support CAD quotes. Otherwise, the CAD may decline in the short term, which will create prerequisites for the growth of USD/CAD.
Support levels: 1.2850, 1.2800, 1.2775, 1.2740, 1.2700, 1.2550, 1.2520
Resistance levels: 1.2880, 1.2912, 1.2938, 1.2960, 1.2975, 1.3070, 1.3100, 1.3223
Trading scenarios
Sell Stop 1.2840. Stop Loss 1.2915. Take-Profit 1.2800, 1.2770, 1.2740, 1.2700, 1.2550, 1.2520
Buy Stop 1.2915. Stop Loss 1.2840. Take-Profit 1.2938, 1.2960, 1.2975, 1.3070, 1.3100, 1.3223