Taking into account the mood of investors prevailing on the market, expecting further steps by the Fed towards tightening its monetary policy, today, after yesterday's attempt at an upward correction, the price of gold resumed the decline. As you know, it does not bring investment income, but it is in active demand in situations of geopolitical and economic uncertainty, as well as a protective asset in the face of rising inflation. However, its quotes are extremely sensitive to changes in the monetary policy of the world's leading central banks and, especially, the Fed.
When interest rates rise, the price of gold tends to decline as the cost to acquire and hold it rises. In the current situation, it seems that when assessing the possibility (or necessity) of investing in this precious metal, investors put the Fed's policy first, relegating geopolitical and inflationary risks to the background, also preferring the dollar as a protective tool.
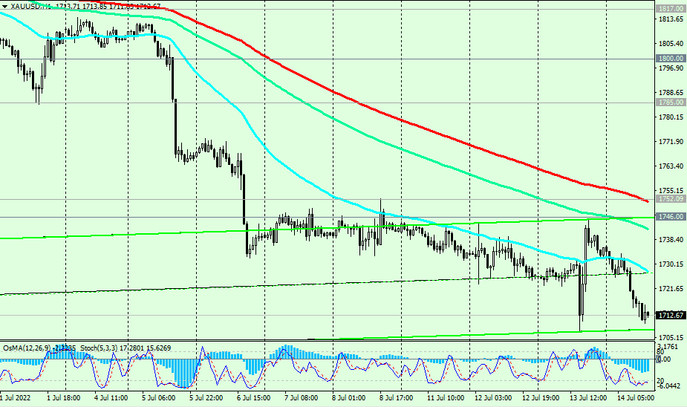
As for the XAU/USD pair, last week it broke through an important long-term support level 1746.00 and today it continues to decline towards the strongest support levels 1687.00, 1682.00, 1668.00. Their breakdown may “push” XAU/USD out of the long-term bull market zone, sending it towards the support levels 1275.00, 1050.00, the breakdown of which will complete this process.
In an alternative scenario, there will be a rebound from the support levels 1682.00, 1687.00 and an upward correction of XAU/USD will begin with the prospect of growth towards the recent “balance line” passing through the 1800.00 mark.
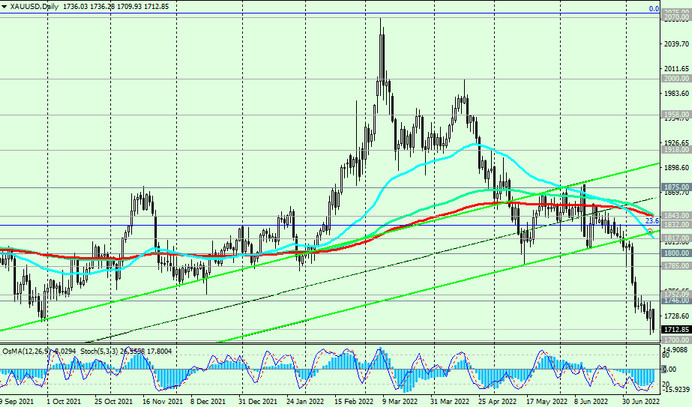
The signal for this will be a breakdown of the resistance levels 1746.00 (EMA144 on the weekly chart), 1752.00 (EMA200 on the 1-hour chart). It is also possible that investors will “remember” gold as a defensive asset in the face of strong geopolitical and inflationary risks. This is the period we are currently experiencing.
And from the news for today, market participants will pay attention to the publication at 12:30 (GMT) of weekly data from the US labor market and US producer price indices (PPI), which are likely to confirm rising inflation in the US.
Support levels: 1700.00, 1687.00, 1682.00, 1668.00
Resistance levels: 1746.00, 1752.00, 1785.00, 1800.00, 1817.00, 1832.00, 1843.00, 1875.00
Trading recommendations
Sell Stop 1706.00. Stop Loss 1753.00. Take-Profit 1700.00, 1687.00, 1682.00, 1668.00
Buy Stop 1753.00. Stop Loss 1706.00. Take-Profit 1785.00, 1800.00, 1817.00, 1832.00, 1843.00, 1875.00