
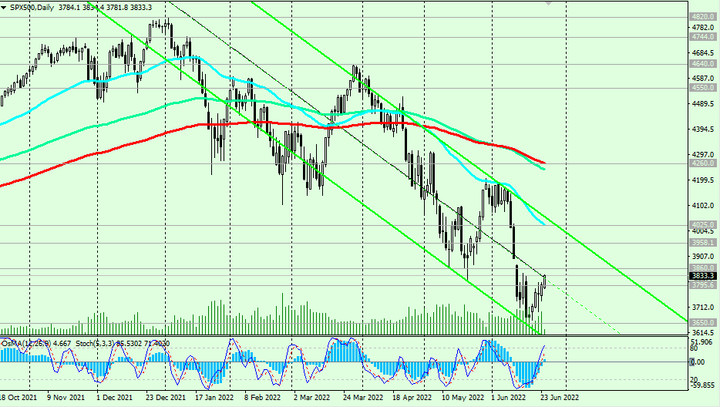
At the time of publication of this article, S&P 500 futures are traded near the 3832.0 mark, testing for a breakdown of the important short-term resistance level 3796.0 (EMA200 on the 1-hour chart). In general, the downward dynamics of the S&P 500 prevails, and a return into the zone below the level 3796.0 will be a signal for the resumption of short positions.
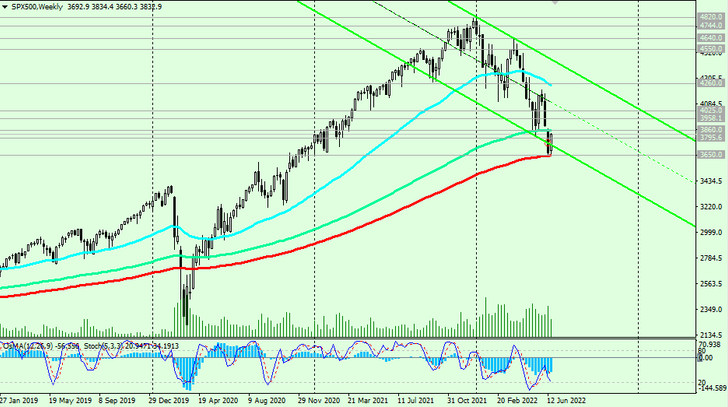
A strong negative momentum remains, which may once again push the S&P 500 towards the important support level 3650.0 (EMA200 on the weekly chart). Its breakdown and further decline may finally push the S&P 500 into the zone of a long-term bear market.
In an alternative scenario, the S&P 500 will resume growth. The signal for the resumption of long positions will be a breakdown of the resistance level 3860.0 (EMA144 on the weekly chart).
Breakdown of the resistance level 4260.0 (EMA200 on the daily chart) will bring the S&P 500 back into the long-term bull market zone.
Support levels: 3795.0, 3650.0
Resistance levels: 3860.0, 3958.0, 4025.0, 4260.0
Trading recommendations
Sell Stop 3780.0. Stop Loss 3837.0. Targets 3700.0, 3650.0, 3600.0
Buy Stop 3837.0. Stop Loss 3780.0. Targets 3900.0, 3958.0, 4025.0, 4260.0, 4300.0, 4400.0, 4500.0, 4600.0, 4700.0, 4800.0