
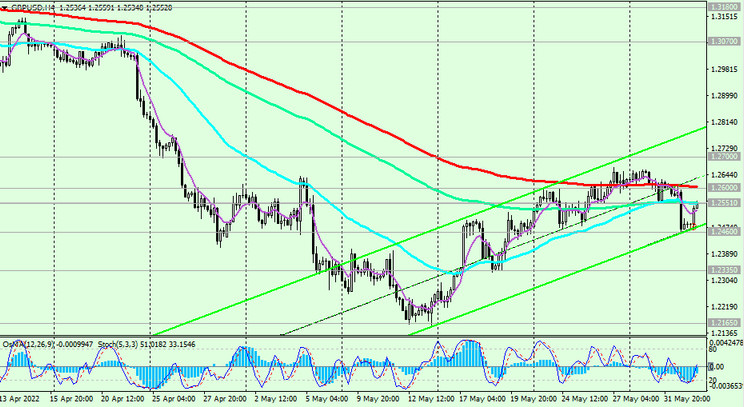
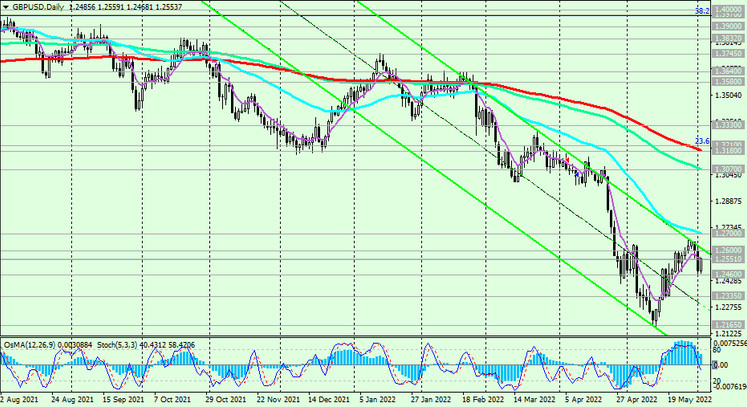
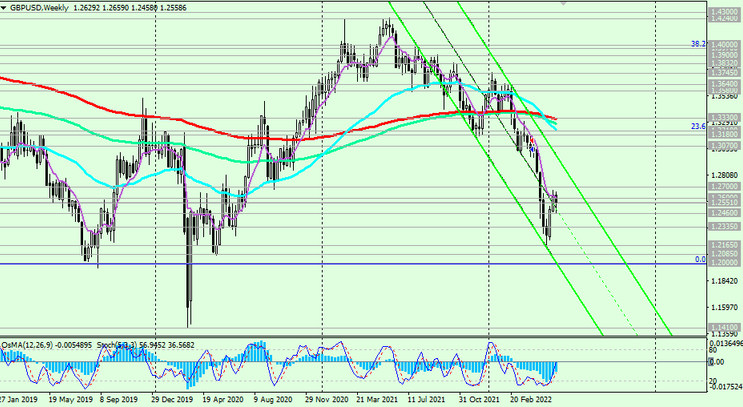
Volatility in GBP/USD quotes remains. After falling on Tuesday and Wednesday, today the GBP/USD is rising again, attempting to break through the important short-term resistance level 1.2551 (EMA200 on the 1-hour chart). So far, the upward correction of GBP/USD is limited by the higher resistance levels 1.2600 (EMA200 on the 4-hour chart), 1.2700 EMA50 on the daily chart). The price also remains within the descending channels on the daily and weekly charts.
The lower border of the descending channel on the weekly chart passes through the zone of local support levels 1.2165, 1.2085, 1.2000. Earlier, we wrote that “more distant targets for the GBP/USD decline are located at local support levels 1.2250, 1.2085, 1.2000 (the low in the GBP/USD decline wave that began in July 2014 near the level of 1.7200)”.
In case of resuming the decline and after the breakdown of the local support level 1.2460, our scenario and reduction targets 1.2165, 1.2085, 1.2000 again become relevant.
A breakdown of the resistance level 1.2700 will open the way for the pair towards the resistance levels 1.3180 (EMA200 on the daily chart), 1.3710 (Fibonacci level 23.6% of the correction to the GBP/USD decline in the wave that began in July 2014 near the 1.7200 mark).
Breakdown of the resistance level 1.3330 (ЕМА200 on the weekly chart) will once again bring the GBP/USD into the zone of a long-term bull market.
Support levels: 1.2460, 1.2335, 1.2165, 1.2100, 1.2085, 1.2000
Resistance levels: 1.2551, 1.2600, 1.2700, 1.2735, 1.3000, 1.3070, 1.3180, 1.3210, 1.3330
Trading recommendations
Sell Stop 1.2450. Stop Loss 1.2565. Take-Profit 1.2400, 1.2335, 1.2165, 1.2100, 1.2085, 1.2000
Buy Stop 1.2565. Stop Loss 1.2450. Take-Profit 1.2600, 1.2700, 1.2735, 1.3000, 1.3070, 1.3180, 1.3210, 1.3330