

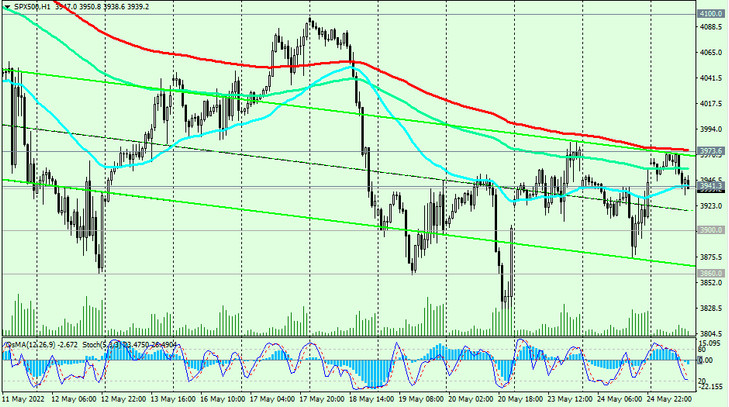
As we noted above, at the time of publication of this article, S&P 500 futures are traded near the 3940.0 mark, testing the short-term support level 3941.0 (EMA200 on the 15-minute chart) for a breakdown. In general, the downward dynamics of the S&P 500 prevails, and the breakdown of the support level 3941.0 will be a signal for the resumption of short positions.
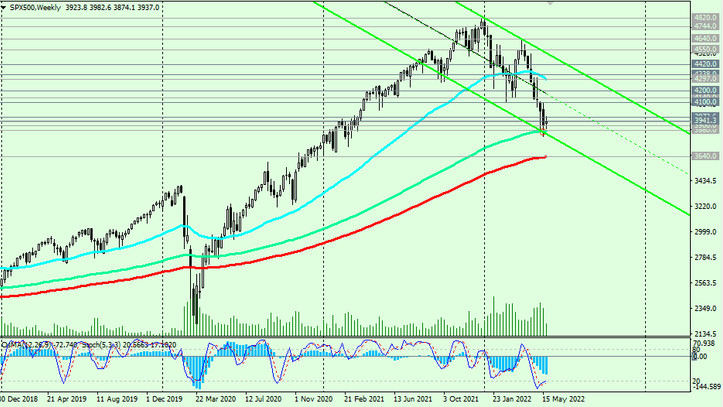
A strong negative momentum remains, which may once again push the S&P 500 towards the important support level 3860.0 (EMA144 on the weekly chart). Further decline and breakdown of the key support level 3640.0 (EMA200 on the weekly chart) may finally push the S&P 500 into the zone of a long-term bear market.
In an alternative scenario, the S&P 500 will resume growth. The first signal for the resumption of long positions will be a breakdown of the short-term resistance level 3973.0 (EMA200 on the 1-hour chart).
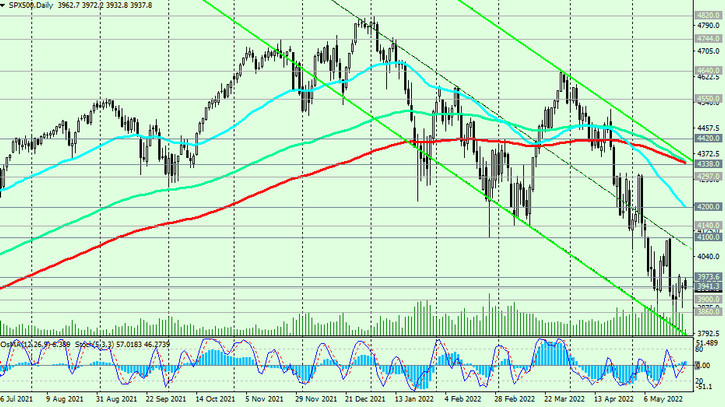
A breakdown of the local resistance level 4100.0 will strengthen the positive dynamics, and a breakdown of the resistance levels 4338.0 (EMA200 on the daily chart), 4420.0 will once again bring the S&P 500 into the zone of a long-term bull market.
Support levels: 3941.0, 3900.0, 3860.0, 3800.0, 3700.0, 3640.0
Resistance levels: 3973.0, 4100.0, 4140.0, 4200.0, 4297.0, 4338.0, 4420.0
Trading recommendations
Sell by market. Stop Loss 3985.0. Targets 3900.0, 3860.0, 3800.0, 3700.0, 3640.0
Buy Stop 3985.0. Stop Loss 3920.0. Targets 4100.0, 4140.0, 4200.0, 4297.0, 4338.0, 4420.0


