
Volatility in GBP/USD quotes remains. Today's decline in the pair has almost completely offset yesterday's growth.
In February of this year, the GBP/USD moved into a bear market zone and despite the correction that started this month from the 1.2165 level, the GBP/USD is in a downtrend, declining in the channels on the daily and weekly charts.
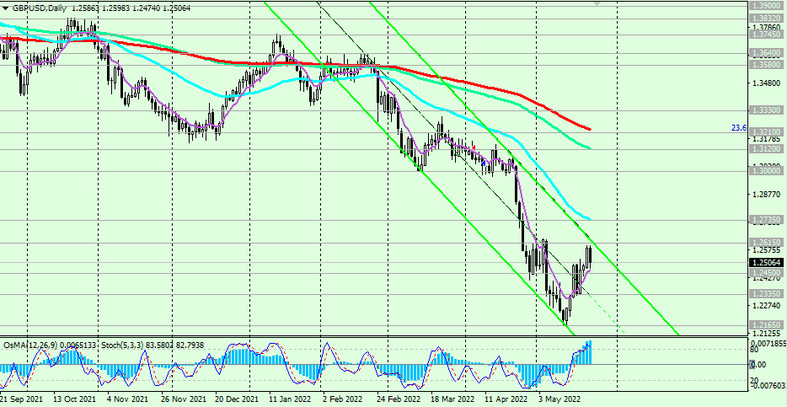
The lower boundary of the descending channel on the weekly chart passes through the zone of local support levels 1.2165, 1.2085, 1.2000. Earlier, we wrote that “more distant targets for the GBP/USD decline are located at local support levels 1.2250, 1.2085, 1.2000 (the low in the GBP/USD decline wave that began in July 2014 near the level of 1.7200)”. It seems that our scenario is coming true, and the decline targets 1.2165, 1.2085, 1.2000 are becoming relevant again.
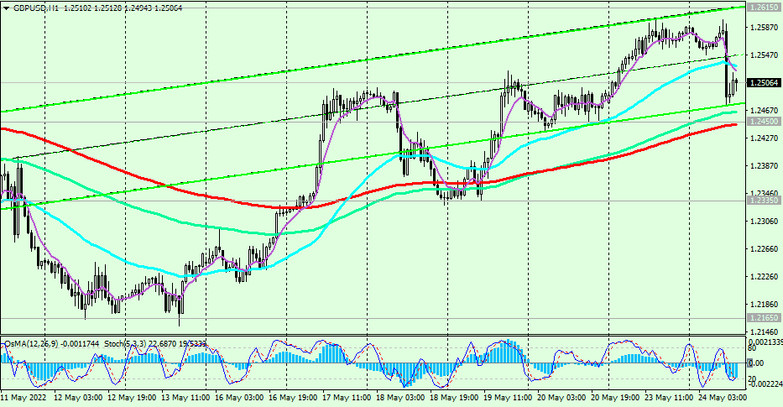
In an alternative scenario, and after the breakdown of the resistance level 1.2615 (EMA200 on the 4-hour chart and the upper limit of the descending channel on the daily chart), GBP/USD will resume growth. However, only growth into the zone above the resistance levels 1.3210 (EMA200 on the daily chart), 1.3330 (EMA200 on the weekly chart) can turn the tide, increasing the likelihood of GBP/USD growth into the zone of a long-term bull market - above the key resistance level 1.4580 (EMA200 on the monthly chart and the Fibonacci 50% retracement to the GBP/USD decline in the wave that began in July 2014 near the level of 1.7200).
Support levels: 1.2450, 1.2335, 1.2165, 1.2100, 1.2085, 1.2000
Resistance levels: 1.2615, 1.2735, 1.3000, 1.3120, 1.3210, 1.3330
Trading recommendations
Stop 1.2445. Stop Loss 1.2535. Take-Profit 1.2400, 1.2335, 1.2165, 1.2100, 1.2085, 1.2000
Buy Stop 1.2535. Stop Loss 1.2445. Take-Profit 1.2615, 1.2735, 1.3000, 1.3120, 1.3210, 1.3330