
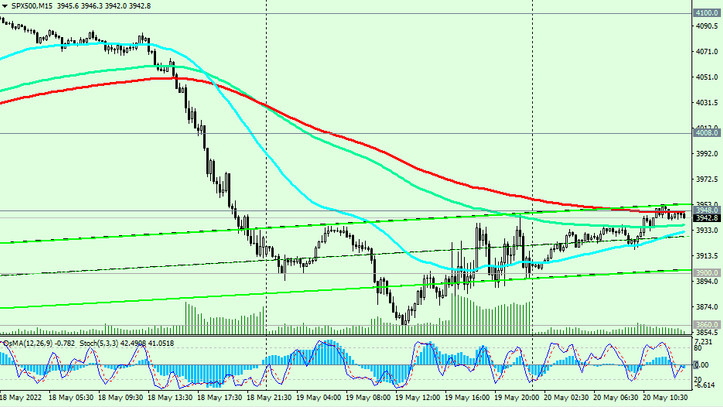
As we noted above, as of this writing, S&P 500 futures are traded near 3942.0, 82 points above yesterday's low of 3860.0.
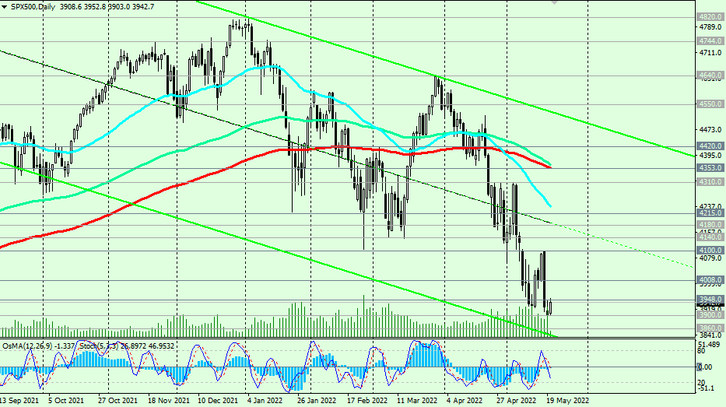
So far, it looks more like a correction after a strong fall the day before and profit taking in short positions. A strong negative momentum remains, which may once again push the S&P 500 towards the important support level 3860.0 (EMA144 on the weekly chart). Further decline and breakdown of the key support level 3640.0 (EMA200 on the weekly chart) may finally push the S&P 500 into the long-term bear market zone.
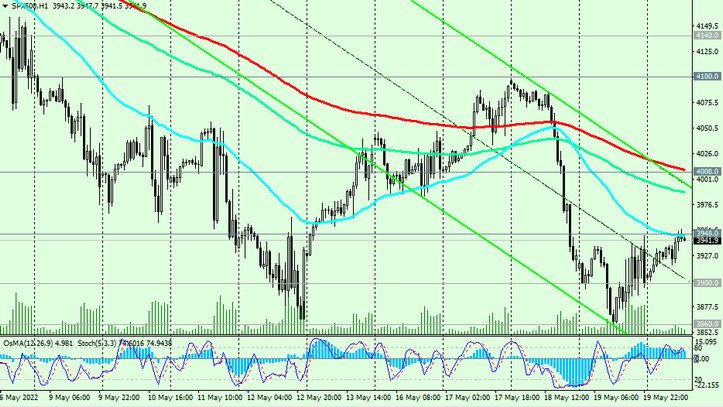
In an alternative scenario, the S&P 500 will resume growth. The first signal for the resumption of long positions will be a breakdown of the short-term resistance level 3948.0 (EMA200 on the 15-minute chart), and the confirming one will be a breakdown of the resistance level 4008.0 (EMA200 on the 1-hour chart).
A breakdown of the local resistance level 4100.0 will strengthen the positive dynamics, and a breakdown of the resistance levels 4353.0 (EMA200 on the daily chart), 4420.0 will once again bring the S&P 500 into the zone of a long-term bull market.
Support levels: 3900.0, 3860.0, 3800.0, 3700.0, 3640.0
Resistance levels: 3948.0, 4008.0, 4140.0, 4215.0, 4310.0, 4353.0, 4420.0
Trading recommendations
Sell Stop 3890.0. Stop Loss 3965.0. Targets 3800.0, 3700.0, 3640.0
Buy Stop 3965.0. Stop Loss 3890.0. Targets 4008.0, 4140.0, 4215.0, 4310.0, 4353.0, 4420.0