As we noted above, "the price of S&P 500 futures broke through the first serious resistance level 4052.0" (EMA200 on the 1-hour chart).
This is the first signal to resume long positions in the S&P 500. If the growth continues, then the next targets will be the resistance levels 4140.0 (local lows), 4225.0 (EMA200 on the 4-hour chart).
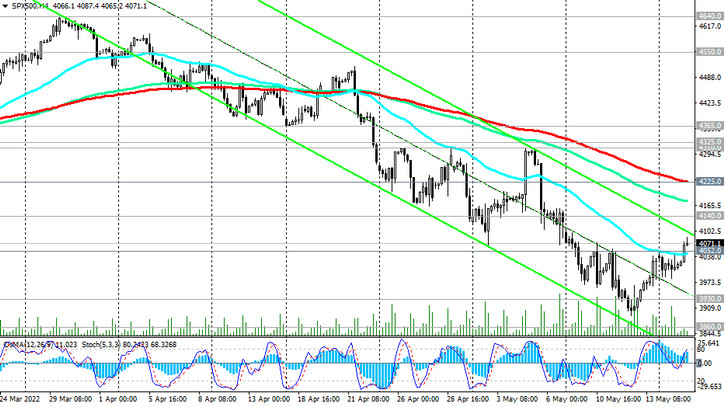
Up to the key resistance level 4365.0 (EMA200 on the daily chart), the S&P 500 is still in the bear market zone. But the breakdown of this resistance level will again bring the S&P 500 into the zone of a long-term and multi-year bull market.
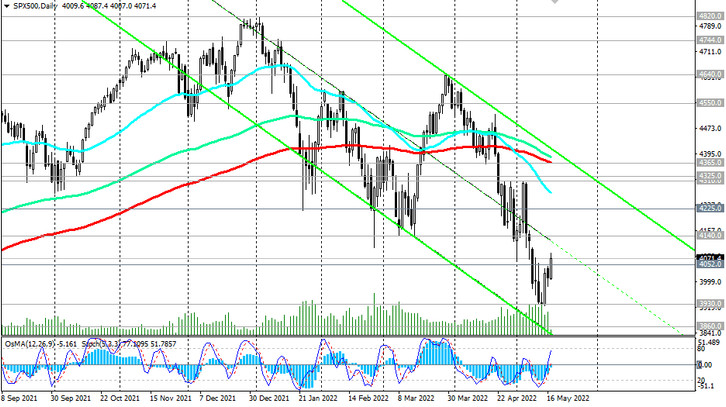
In an alternative scenario, and after the breakdown of the support level 4052.0, the decline in the S&P 500 may resume with renewed vigor. In our previous review for 05/09/2022, we wrote that "the target of the fall of the S&P 500 is the support levels 3950.0 (the lower limit of the downward channel on the weekly chart), 3860.0 (EMA144 on the weekly chart)". These goals have been achieved and after the resumption of decline again become relevant.
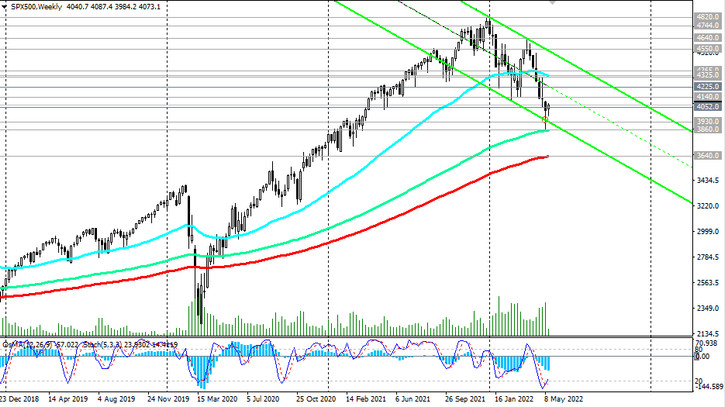
A deeper downward correction will be associated with a decline to the key long-term support level 3640.0 (EMA200 on the weekly chart), the breakdown of which increases the risks of breaking the long-term long-term bullish trend of the S&P 500.
Support levels: 4052.0, 4000.0, 3930.0, 3900.0, 3860.0, 3800.0, 3700.0, 3640.0
Resistance levels: 4140.0, 4225.0, 4310.0, 4325.0, 4365.0
Trading recommendations
Sell Stop 4030.0. Stop Loss 4110.0. Targets 4000.0, 3930.0, 3900.0, 3860.0, 3800.0, 3700.0, 3640.0
Buy Stop 4110.0. Stop Loss 4030.0. Targets 4140.0, 4225.0, 4310.0, 4325.0, 4365.0