During today's Asian trading session, the US dollar continued to rise, with the DXY dollar index hitting a new high since April 2020 above 101.70. Expectations of a more aggressive rate hike by the Fed dampened investor risk appetite and strengthened the dollar.
Meanwhile, Chinese stock markets suffered their biggest losses in more than two years today as the number of coronavirus infections in China's major cities surged. On Monday, the Shanghai Composite and CSI 300 fell 5.1% and 4.9%, respectively. This was the strongest drop in indices since February 2020, when the pandemic had just begun. Investors fear that the Chinese government's crackdown on COVID-19 will further destabilize global supply chains. New quarantine restrictions in China and Russia's special military operation in Ukraine are likely to only increase the negative pressure on the market. Today, the offshore yuan is down about 1% to 6.6060 yuan per dollar, hitting its lowest level since November 2020, according to FactSet data. The yuan also fell last week.
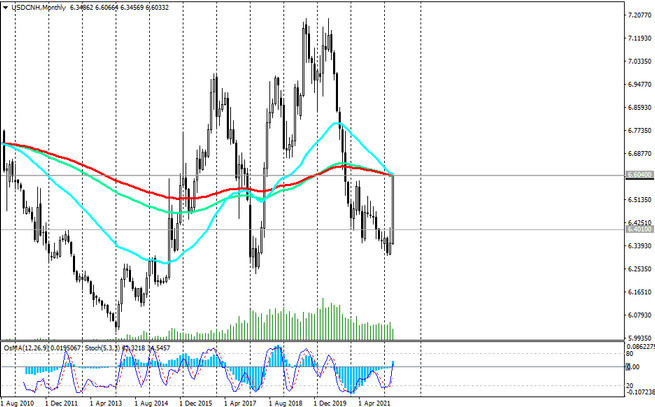
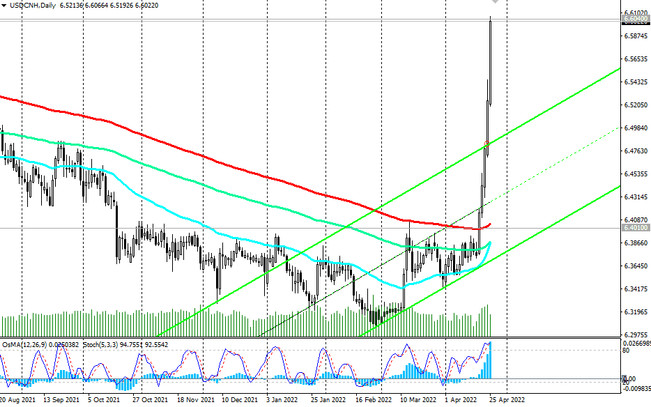
The USD/CNH pair rose to the strongest long-term resistance level 6.0640 (EMA200, EMA144, EMA50 on the monthly chart, EMA200 on the weekly chart), having briefly exceeded it.
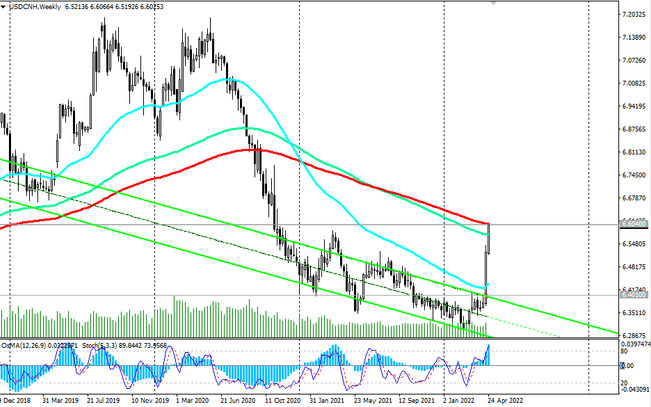
Considering the previous few months of relatively stable dynamics and the decline of USD/CNH, it is logical to assume at least a rebound from the achieved resistance level of 6.6040, and at the maximum, a resumption of decline if more positive news from the front of the fight against COVID begins to come from China.
Market participants watching the yuan and the USD/CNH pair will pay attention tomorrow to the publication (at 06:00 GMT) of China's foreign trade data (some decrease in the trade surplus is expected in March) and data on orders for durable goods (for March) in the USA (some growth is expected here after a significant drop in indicators in February).
Support levels: 6.5200, 6.4700, 6.4010
Resistance levels: 6.6040, 6.6060
Trading recommendations
Sell by market, Sell Stop 6.5190. Stop Loss 6.6070. Take-Profit 6.5100, 6.5000, 6.4700, 6.4100, 6.4000, 6.3100
Buy Stop 6.6060. Stop Loss 6.5190. Take-Profit 6.6200, 6.6300, 6.6400, 6.6500