

Since January 2021, the USD/CAD pair has been trading in a range between the levels 1.2960 and 1.2010. The line of balance is the level 1.2540 (EMA200 on the monthly chart). Its breakdown will send USD/CAD towards the lower border of the range and towards 1.2010, which will mean the final break into the long-term bear market zone.
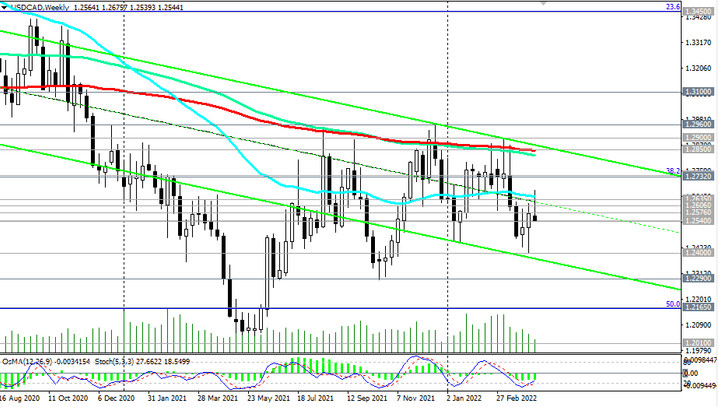
USD/CAD is also traded below the key resistance levels 1.2635 (EMA200, EMA144 on the daily chart), 0.2850 (EMA200 on the weekly chart). Downward dynamics prevails, making short positions preferable. Breakdown of the support level 1.2540 will be a signal for their growth.
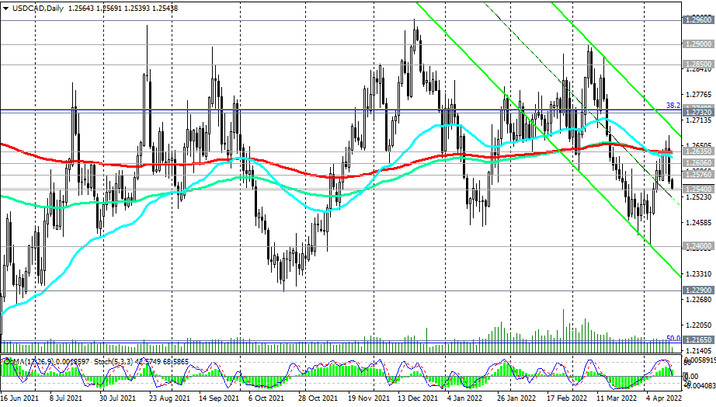
In an alternative scenario, the first signal to resume long positions will be a breakdown of the resistance level 1.2576 (EMA200 on the 1-hour chart). In this case, the target of the upward correction will be the resistance levels 1.2606 (EMA200 on the 4-hour chart), 1.2635 (EMA200 on the daily chart).
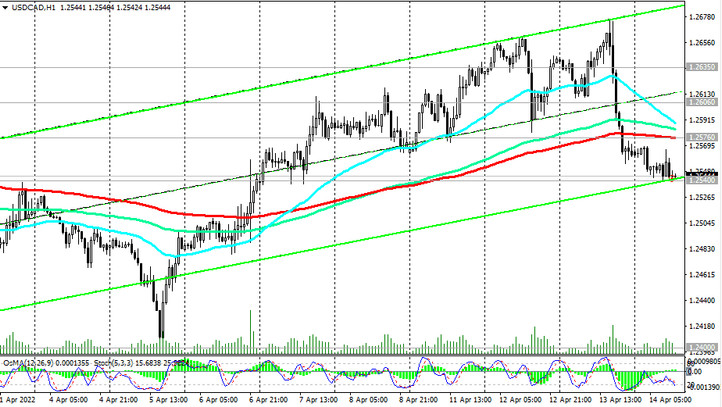
Breakdown of the local resistance level 1.2675 (intra-monthly maximum) may provoke further growth towards resistance levels 1.2850 (EMA200 and the upper limit of the downward channel on the weekly chart), 1.2960. Their breakdown, in turn, will mean the return of USD/CAD into the zone of a long-term bull market.
Support levels: 1.2540, 1.2450, 1.2400, 1.2290, 1.2165, 1.2050
Resistance levels: 1.2576, 1.2606, 1.2635, 1.2675, 1.2700, 1.2730, 1.2800, 1.2850, 1.2900
Trading scenarios
Sell Stop 1.2530. Stop Loss 1.2585. Take-Profit 1.2500, 1.2450, 1.2400, 1.2290, 1.2165, 1.2050
Buy Stop 1.2585. Stop Loss 1.2530. Take-Profit 1.2600, 1.2635, 1.2675, 1.2700, 1.2730, 1.2800, 1.2850, 1.2900


