
Since December 2021, AUD/NZD has been trading in an uptrend. Having started growth from the level 1.0430, the pair during this time has grown by 4.3%, approaching the upper limit of the range formed between the levels 1.0950 and 1.0320.
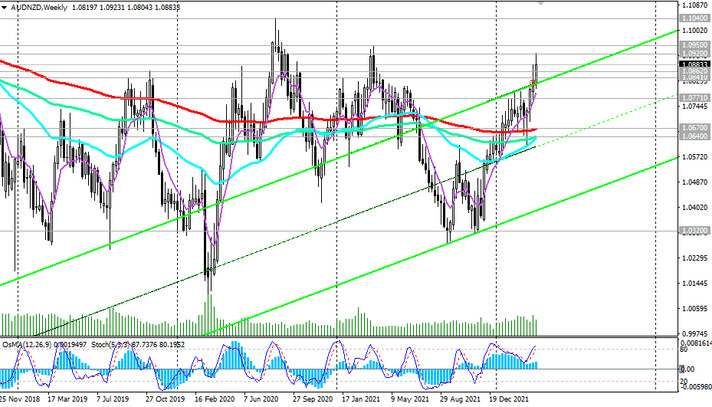
In the zone above the key support levels 1.0670 (EMA200 on the weekly chart), 1.0640 (EMA200 on the daily chart), AUD/NZD remains in the bull market zone, maintaining positive dynamics.
In this situation, long positions are considered preferable, and the growth targets are the resistance levels 1.0950 and 1.1040 (EMA144 on the monthly chart and the local resistance level).
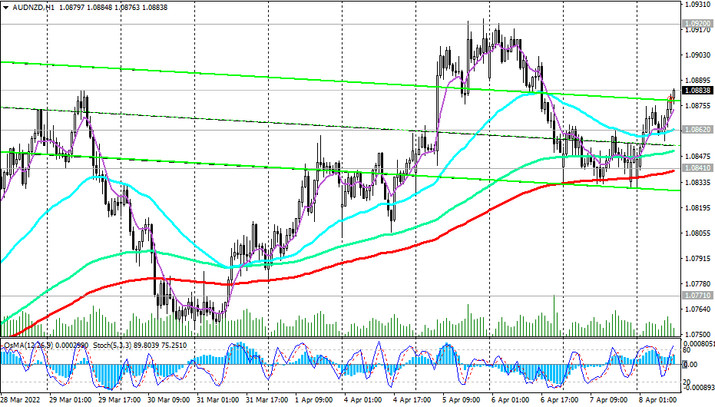
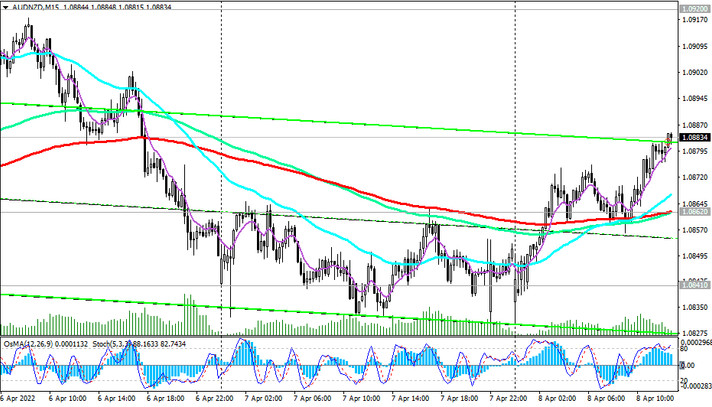
In an alternative scenario, there will be a reversal from the current levels, and the first signal to open short positions will be a breakdown of the short-term support level 1.0862 (EMA200 on a 15-minute chart). The breakdown of support levels 1.0841 (EMA200 on the 1-hour chart), 1.0830 (local support level) will become a confirming signal.
Support levels: 1.0862, 1.0841, 1.0830, 1.0800, 1.0771, 1.0670, 1.0640, 1.0600
Resistance levels: 1.0885, 1.0920, 1.0950, 1.1000, 1.1040
Trading Recommendations
Sell Stop 1.0820. Stop Loss 1.0890. Take-Profit 1.0800, 1.0771, 1.0670, 1.0640, 1.0600
Buy Stop 1.0890. Stop Loss 1.0820. Take-Profit 1.0920, 1.0950, 1.1000, 1.1040