
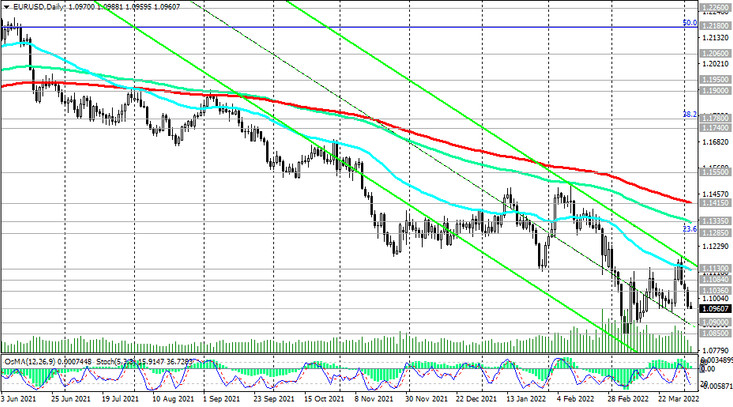
EUR/USD continues to trade in the bear market zone, declining within the descending channels on the daily and weekly charts. The lower border of the descending channel on the weekly chart is below 1.0700, near the lows of March 2020.
Probably, this mark can become a reference point for short positions on the pair with intermediate targets at 1.0900, 1.0850, 1.0800, 1.0765.
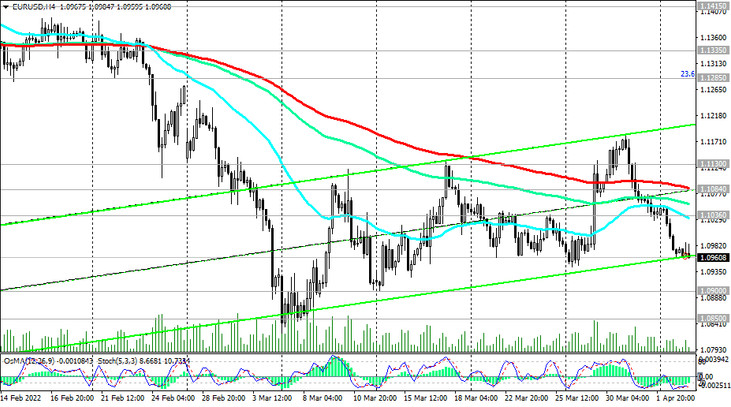
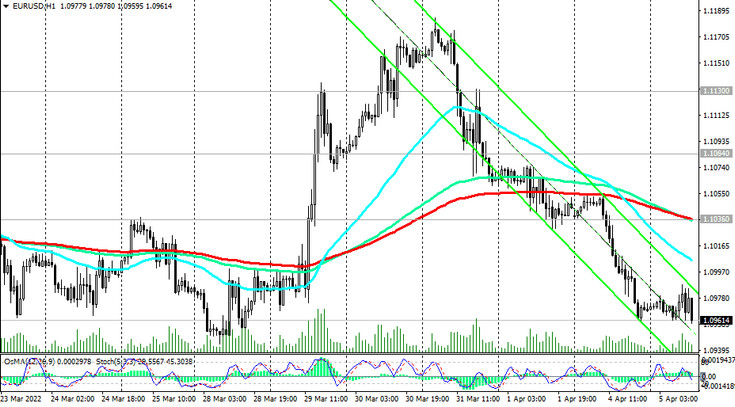
In the area below the resistance levels 1.1036 (EMA200 on the 1-hour chart), 1.1084 (EMA200 on the 4-hour chart), 1.1130 (EMA50 and the upper line of the descending channel on the daily chart), nothing threatens short positions in EUR/USD.
In an alternative scenario, corrective growth may begin after the breakdown of the short-term resistance level 1.1006 (EMA200 on a 15-minute chart) with targets at resistance levels 1.1036, 1.1084, 1.1100, 1.1130, near which pending sell orders can be placed.
Below resistance levels 1.1285 (Fibonacci 23.6% of the upward correction in the wave of the pair's decline from the level 1.3870, which began in May 2014, to 1.0500), 1.1335 (local highs and ЕМА144 on the daily chart), 1.1415 (ЕМА200 on the daily chart) EUR/USD is in the bear market zone. Downward dynamics prevails, making short positions preferable.
Support levels: 1.0900, 1.0850, 1.0765, 1.0700, 1.0500, 1.0350
Resistance levels: 1.1006, 1.1036, 1.1084, 1.1130, 1.1200, 1.1285, 1.1300, 1.1335, 1.1415, 1.1500, 1.1550, 1.1740, 1.1780
Trading Recommendations
Sell by market. Sell Limit 1.1036, 1.1084, 1.1100, 1.1130. Stop Loss 1.1180. Take-Profit 1.0950, 1.0900, 1.0850, 1.0765, 1.0700, 1.0500, 1.0350
Buy Stop 1.1010. Stop Loss 1.0960. Take-Profit 1.1036, 1.1084, 1.1100, 1.1130