

Since the beginning of this month, AUD/USD has been developing an upward correction, strengthening towards the key long-term resistance level 0.7300 (EМА200 on the daily and weekly charts).
Below this resistance level, AUD/USD is in a bear market zone. An upward correction may yet send AUD/USD towards the long-term resistance level 0.7265 (EMA144 on the daily chart) after breaking through the upper limit of the descending channel on the daily chart, passing through 0.7220. However, only a breakdown of the resistance level 0.7300 can again turn the tide and bring AUD/USD into the bull market zone.
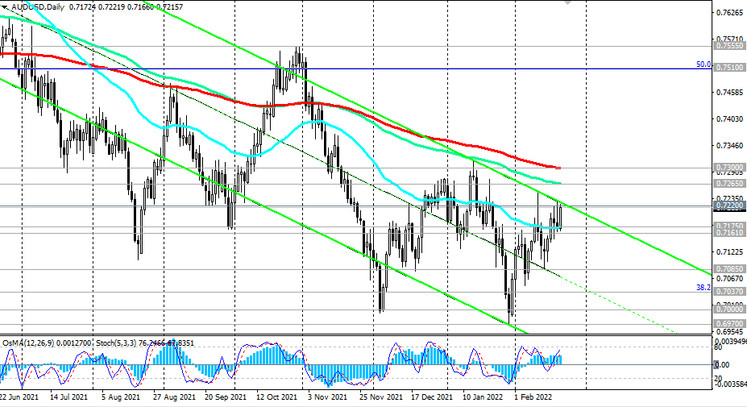
In the main scenario, we expect AUD/USD to resume its decline, and the signal for this will be a breakdown of support levels 0.7175 (EMA50 on the daily chart), 0.7161 (EMA200 on the 4-hour chart). As long as AUD/USD remains in the global bearish trend, short positions should be preferred.
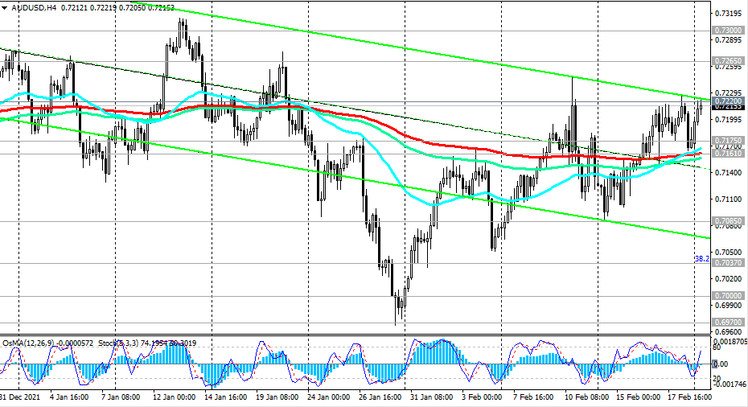
In case of a breakdown of the local support level 0.7085, the pair is waiting for a further deeper decline inside the descending channel on the daily chart. Its lower limit is below 0.6800. In this case, intermediate targets will be the support levels 0.7037 (Fibonacci 38.2% of the correction to the wave of the pair’s decline from the level 0.9500 in July 2014 to the lows of 2020 near the level 0.5510), 0.7000, 0.6970 (the lower limit of the descending channel on the weekly chart).
Support levels: 0.7175, 0.7161, 0.7085, 0.7037, 0.7000, 0.6970, 0.6900, 0.6800, 0.6455
Resistance levels: 0.7220, 0.7265, 0.7300
Trading Recommendations
AUD/USD: Sell Stop 0.7155. Stop Loss 0.7235. Take-Profit 0.7100, 0.7085, 0.7037, 0.7000, 0.6970, 0.6900, 0.6800, 0.6455
Buy Stop 0.7235. Stop Loss 0.7190. Take Profit 0.7265, 0.7300


