
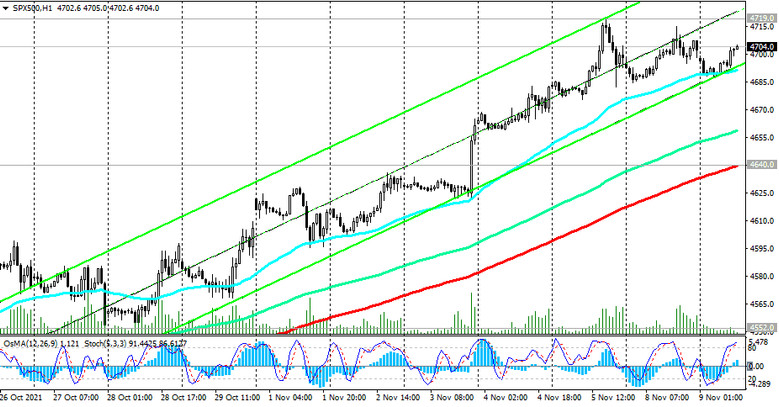
As we noted above, S&P 500 futures reached a new all-time high at 4719.0 late last week. Investors maintain a positive outlook, while S&P 500 futures - positive dynamics and a tendency to further rise against the backdrop of a favorable fundamental background. A breakdown of the local resistance level 4719.0 will be a signal to build up long positions.
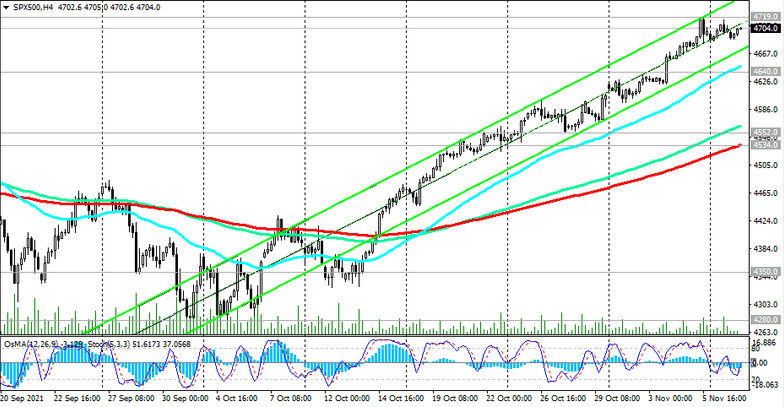
In an alternative scenario, a signal for short-term sales will be a breakdown of the short-term support level 4640.0 (ЕМА200 on the 1-hour chart). In this case, the immediate target of the correctional decline will be the support levels 4552.0, 4534.0 (ЕМА200 on the 4-hour chart), and the more distant one - the support level 4350.0 (ЕМА144 on the daily chart).
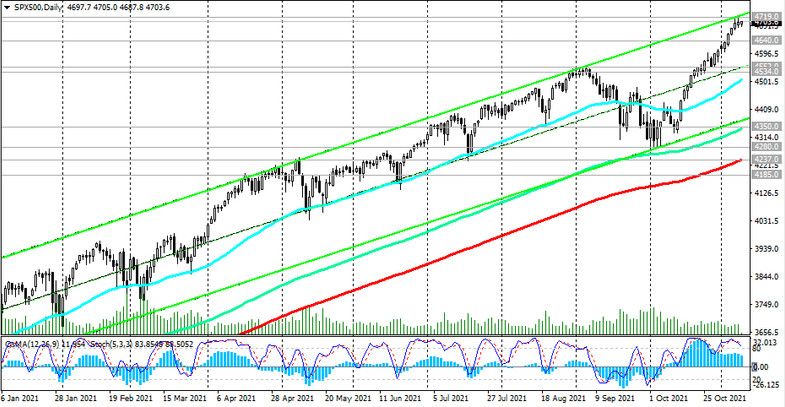
However, only a breakdown of the long-term support levels 4237.0 (ЕМА200 on the daily chart), 4185.0 (ЕМА50 on the weekly chart) may increase the risks of breaking the long-term bullish trend of the S&P 500.
Thus, above the support levels 4640.0, 4552.0, 4534.0, long positions remain preferable.
Support levels: 4640.0, 4552.0, 4534.0, 4350.0, 4280.0, 4217.0, 4185.0
Resistance levels: 4719.0, 4800.0
Trading recommendations
Sell Stop 4638.0. Stop-Loss 4720.0. Targets 4600.0, 4552.0, 4534.0, 4350.0, 4280.0, 4217.0, 4185.0
Buy Stop 4720.0. Stop-Loss 4538.0. Targets 4800.0, 4900.0