

In October, which became one of the most successful for AUD / USD this year, the pair rose significantly, breaking into the zone above the key resistance levels 0.7340 (ЕМА200 on the weekly chart), 0.7435 (ЕМА200 on the daily chart).
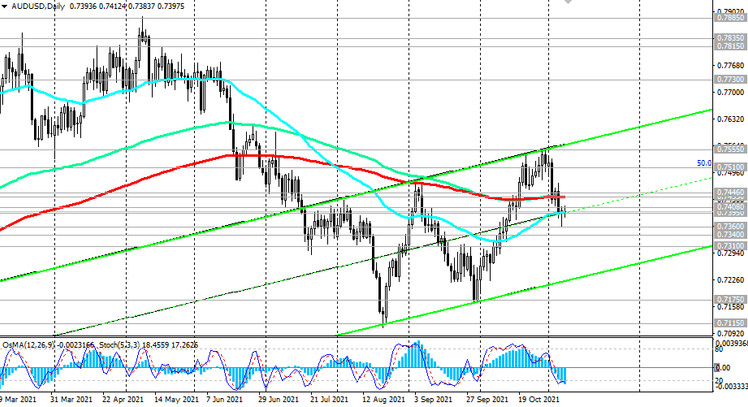
However, the results of the RBA meeting ended last week forced AUD / USD to fall sharply. Today AUD / USD is trying to recover from this drop, stabilizing at the support level 0.7395 (ЕМА50 on the daily chart).
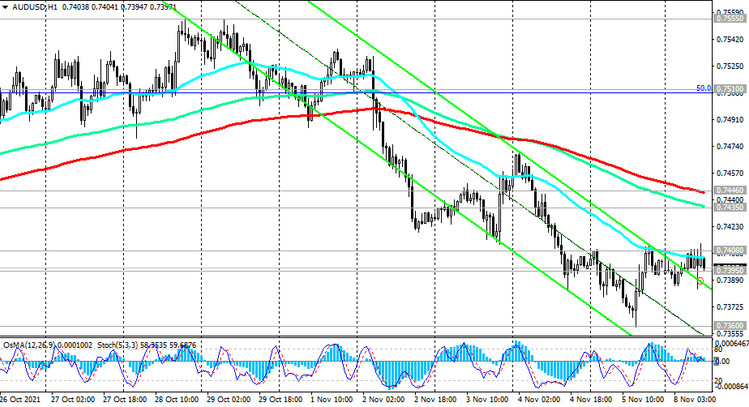
Nevertheless, it is too early to speak about the resumption of long positions. A signal to open them will be a breakdown of the key resistance level 0.7435 and the important short-term resistance level 0.7446 (ЕМА200 on the 1-hour chart). The nearest growth targets are located at resistance levels 0.7510 (Fibonacci level 50% retracement to the wave of the pair's decline from 0.9500 in July 2014 to 2020 lows near 0.5510) and near the local 3-month high of 0.7555, reached at the end of October.
Confirmed breakdown of the long-term resistance level 0.7730 (ЕМА200 on the monthly chart) is likely to complete the AUD / USD transition into the long-term bull market zone.
In an alternative scenario, the decline in AUD / USD will continue. The breakdown of the support levels 0.7360, 0.7340, 0.7310 (ЕМА144 on the weekly chart) will indicate the transition of AUD / USD into the zone of the long-term bear market.
Support levels: 0.7395, 0.7360, 0.7340, 0.7310, 0.7175, 0.7115
Resistance levels: 0.7408, 0.7435, 0.7446, 0.7510, 0.7555, 0.7570, 0.7730
Trading Recommendations
Sell Stop 0.7375. Stop-Loss 0.7420. Take-Profit 0.7360, 0.7340, 0.7310, 0.7200, 0.7175, 0.7115
Buy Stop 0.7420. Stop-Loss 0.7375. Take-Profit 0.7435, 0.7446, 0.7510, 0.7555, 0.7570, 0.7730


