As we noted above, the S&P 500 hit a new all-time high at 4561.0 last week. Today, S&P 500 futures are traded slightly below this level, but they maintain positive dynamics and a tendency to further rise against the background of a favorable fundamental background.
At the time of publication of this article, S&P 500 futures are traded near 4451.0, and a breakdown of the local resistance level 4561.0 will be a signal to build up long positions.
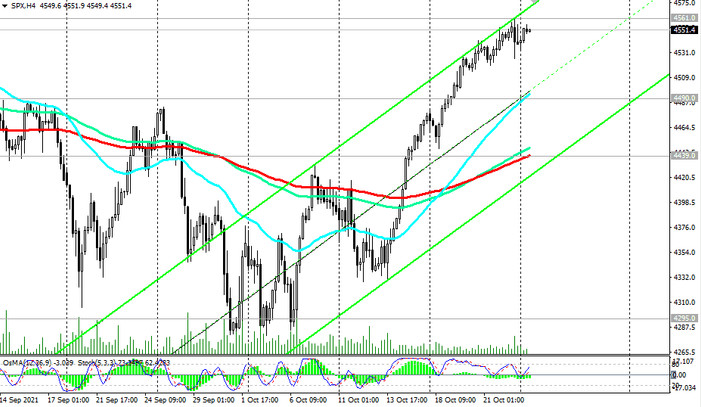
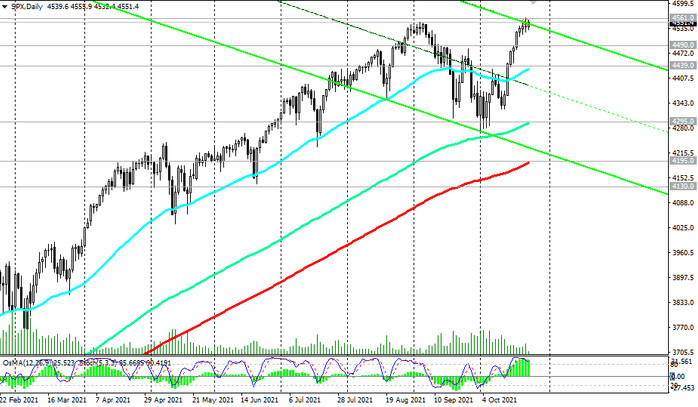
In an alternative scenario, a signal for short-term sales will be a breakdown of the local support level 4525.0, and a breakdown of the short-term important support level 4490.0 (ЕМА200 on the 1-hour chart) will become a confirmation signal. The closest target of the correctional decline in this case will be the support level 4439.0 (ЕМА200 on the 4-hour chart and ЕМА50 on the daily chart), and the more distant one - support level 4295.0 (ЕМА144 on the daily chart).
However, only a breakdown of the long-term support levels 4195.0 (ЕМА200 on the daily chart), 4130.0 (ЕМА50 on the weekly chart) may increase the risks of breaking the long-term bullish trend of the S&P 500.
in any case, above the support levels 4490.0, 4439.0, long positions remain preferable.
Support levels: 4525.0, 4490.0, 4439.0, 4295.0, 4195.0, 4130.0
Resistance levels: 4561.0, 4600.0, 4700.0
Trading recommendations
Sell Stop 4523.0. Stop-Loss 4563.0. Targets 4490.0, 4439.0, 4295.0, 4195.0, 4130.0
Buy Stop 4563.0. Stop-Loss 4523.0. Targets 4600.0, 4700.0, 4800.0