As we noted above, oil prices remain in the bull market, trading above long-term and short-term key support levels.
At the time of publication of this article, Brent oil futures are traded near 84.40, heading towards the local multi-year high reached yesterday, near $ 85.51 a barrel.
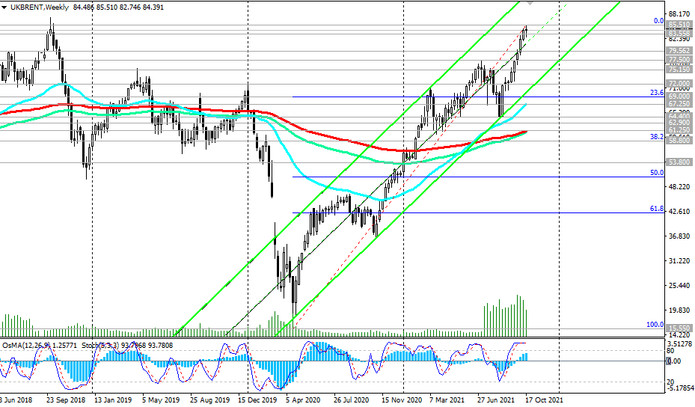
A breakdown of this local resistance level will lead to further price growth, while oil market analysts predict that the oil market will continue to positive dynamics amid expectations of a cold winter amid increased demand for energy and limited oil supplies by OPEC+ countries.
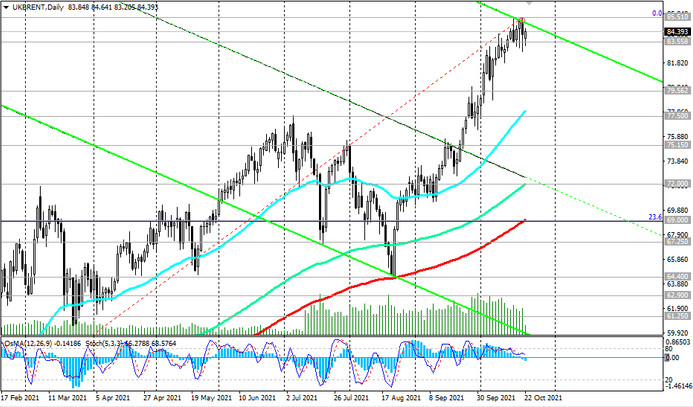
In an alternative scenario and in case of a confirmed breakdown of the local support level 82.75, the price may decline to the long-term support level 79.60 (ЕМА200 on the monthly chart). An important short-term support level (EMA200 on a 4-hour chart) is also crossing the 79.60 mark.
Above this support level, preference should be given to long positions. However, in case of its breakdown, a deeper downward correction towards the lower boundary of the ascending channel on the weekly chart and the 72.00 mark is possible, through which the long-term support level (ЕМА144 on the daily chart) also passes.
A breakdown of the key long-term support level 69.00 (ЕМА200 on the daily chart and Fibonacci level 23.6% of the correction to the wave of growth from record lows after the collapse of prices in March 2020) will increase the negative dynamics and the likelihood of a return into a long-term downtrend.
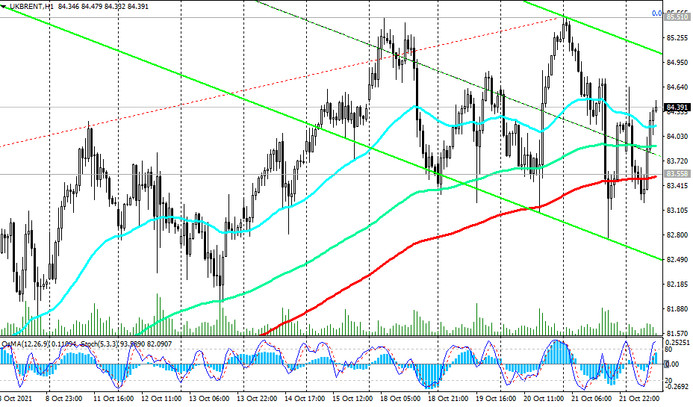
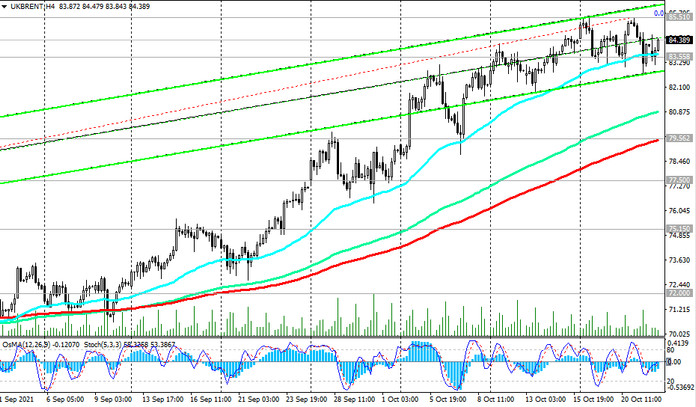
The first signal for the implementation of this scenario and the resumption of short positions will be a breakdown of the short-term support level 83.55 (ЕМА200 on the 1-hour chart).
Support levels: 83.55, 82.75, 79.60, 77.50, 75.15, 72.00, 69.00, 67.25, 64.40, 62.90, 61.25, 58.80
Resistance levels: 85.51, 87.20
Trading recommendations
Sell Stop 83.20. Stop-Loss 85.10. Take-Profit 82.75, 79.60, 77.50, 75.15, 72.00, 69.00, 67.25, 64.40, 62.90, 61.25, 58.80
Buy Stop 85.10. Stop-Loss 83.20. Take-Profit 86.00, 87.00, 88.00