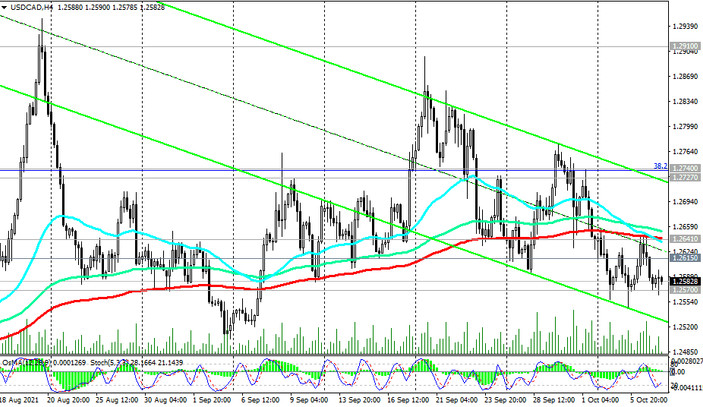
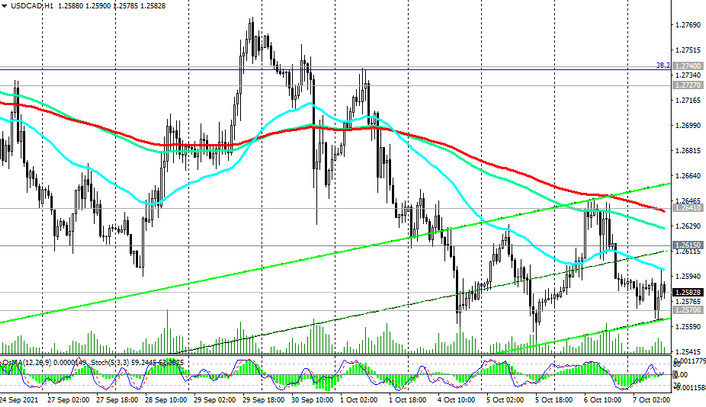
After the price broke through the key support level 1.2615 (ЕМА200, ЕМА50 on the daily chart) at the beginning of the month, today and for the third day in a row USD / CAD is traded in the range between the resistance levels 1.2615 and support levels 1.2570 (ЕМА144 on the daily chart).
The wider range is limited by the levels 1.2655 and 1.2545. It is obvious that a break in one direction or another of this range will indicate the direction of further USD/CAD dynamics.
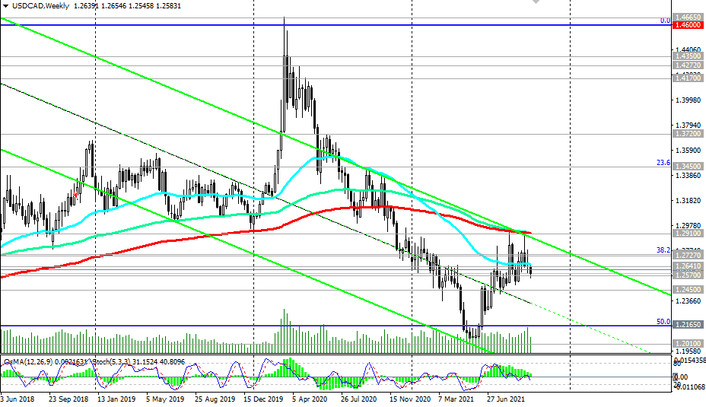
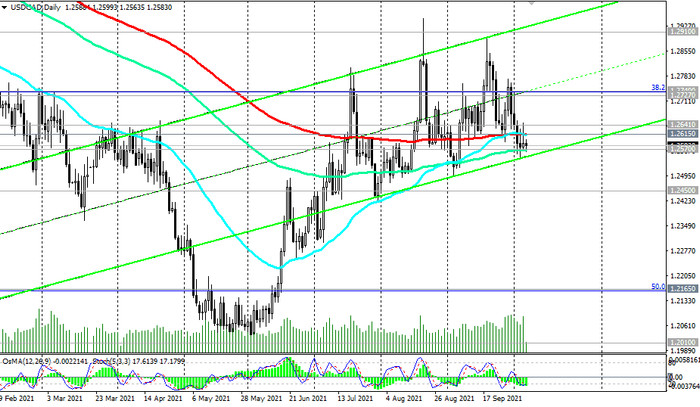
In case of breakdown of the support levels 1.2570, 1.2545 USD / CAD will go inside the descending channel on the weekly chart with an intermediate target at the long-term support level 1.2450 (ЕМА200, ЕМА144 on the monthly chart).
In an alternative scenario and after a return into the zone above resistance levels 1.2615, 1.2655 USD / CAD may develop an upward trend in the direction of resistance levels 1.2740 (Fibonacci level 38.2% of the downward correction in the wave of USD / CAD growth from 0.9700 to 1.4600), 1.2910 (ЕМА200 on the weekly chart). Break of the resistance level 1.2910 will confirm the recovery of the bullish dynamics of USD / CAD.
Support levels: 1.2570, 1.2545, 1.2500, 1.2450, 1.2165
Resistance levels: 1.2615, 1.2655, 1.2740, 1.2910
Trading scenarios
Sell Stop 1.2540. Stop-Loss 1.2660. Take-Profit 1.2500, 1.2450, 1.2330, 1.2200, 1.2165, 1.2100
Buy Stop 1.2660. Stop-Loss 1.2540. Take-Profit 1.2700, 1.2740, 1.2800, 1.2825, 1.2920