
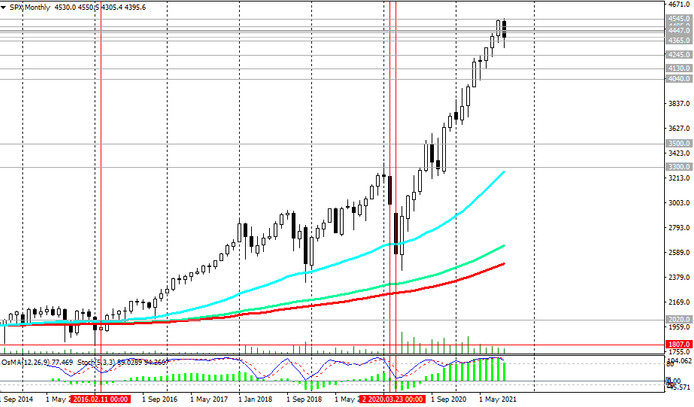
In early September, the S&P 500 reached a new all-time high near 4550.0, showing bullish dynamics for many years.
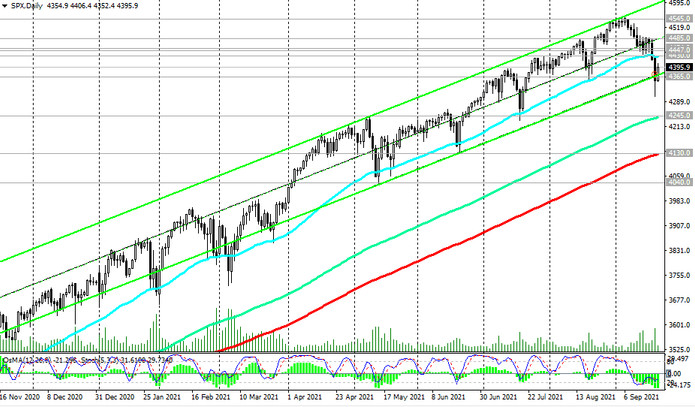
However, then a 3-week decline began, reaching yesterday a local 9-week low near 4305.0. However, the S&P 500 corrected in the afternoon of yesterday's trading, retracing nearly half of its intraday losses. Today its growth continues, and the price was able to return inside the ascending channel on the daily chart, the upper border of which is near 4600.0.
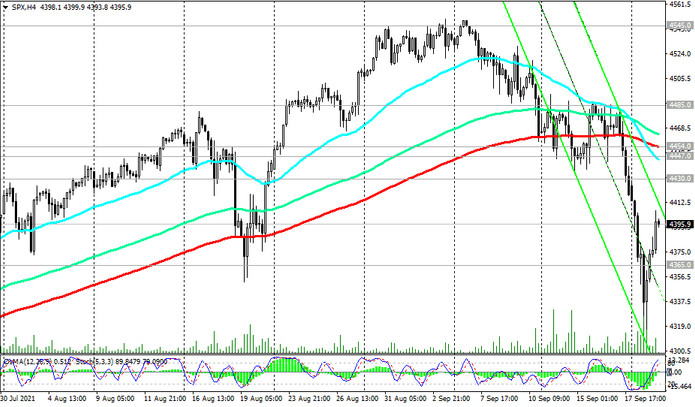
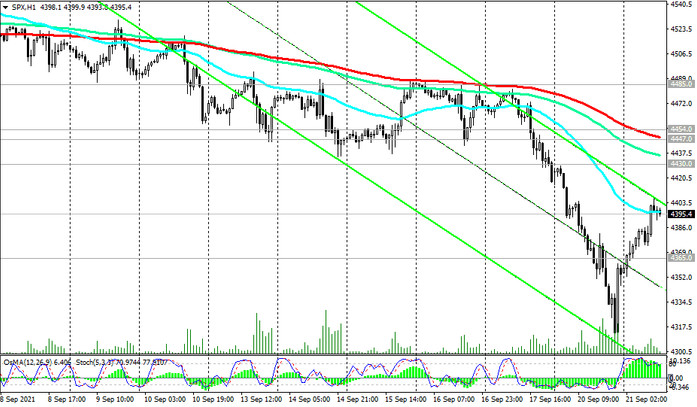
The nearest resistance levels, which the price will have to overcome before heading towards 4600.0, are at 4430.0 (ЕМА50 on the daily chart), 4447.0 (ЕМА200 on the 1-hour chart), 4454.0 (ЕМА200 on the 4-hour chart).
Their breakdown will be a confirmation signal for the resumption of purchases.
In an alternative scenario, a breakdown of the local support level 4305.0 may provoke a deeper correction to the support level 4245.0 (ЕМА144 on the daily chart). Its breakdown, in turn, will be a signal for a further decline to support levels 4130.0 (ЕМА200 on the daily chart and the lower border of the ascending channel on the weekly chart), 4040.0. The first signal for the implementation of this scenario may be a breakdown of the local support level 4365.0.
Nevertheless, in the current situation, long positions are still preferred.
Support levels: 4365.0, 4300.0, 4245.0, 4130.0, 4040.0
Resistance levels: 4430.0, 4447.0, 4454.0, 4485.0, 4545.0
Trading recommendations
Sell Stop 4350.0. Stop-Loss 4410.0. Targets 4300.0, 4245.0, 4130.0, 4040.0
Buy by market, Buy Stop 4410.0. Stop-Loss 4350.0. Targets 4430.0, 4447.0, 4454.0, 4485.0, 4545.0, 4600.0


