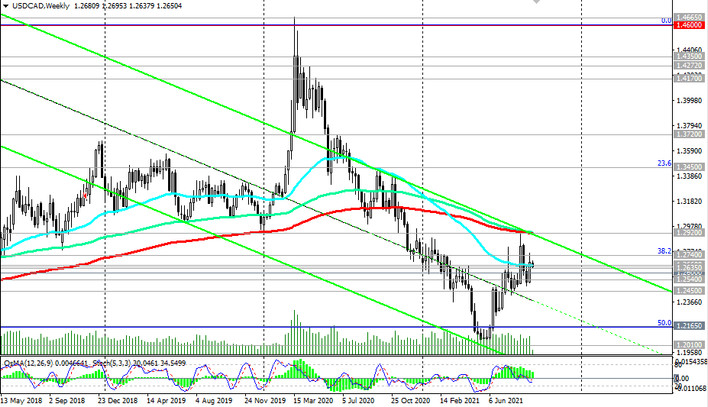
At the time of publication of this article, USD / CAD is traded near the 1.2660 mark, through which a strong resistance level (ЕМА50 on the weekly chart) passes.
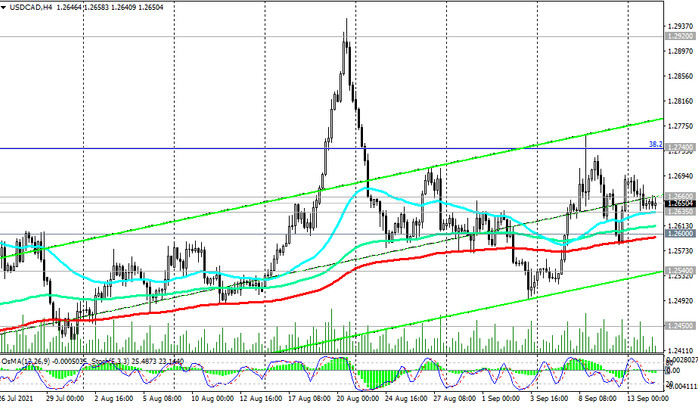
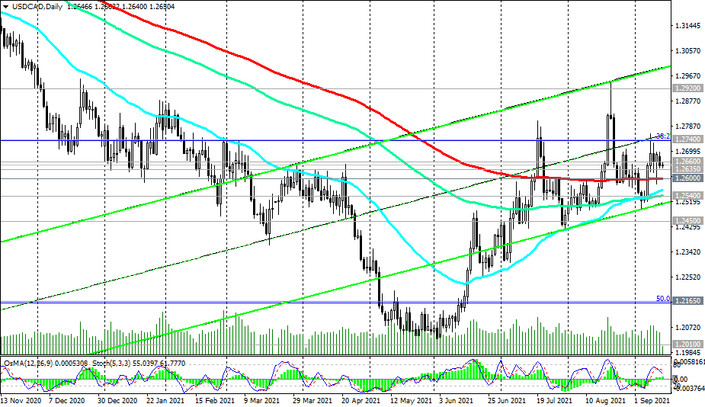
At the same time, USD / CAD remains in the bull market, trading above the important support levels 1.2635 (ЕМА200 on the 1-hour chart), 1.2600 (ЕМА200 on the 4-hour and daily charts). Above these support levels, the positive dynamics of USD / CAD remains, which makes long positions more preferable.
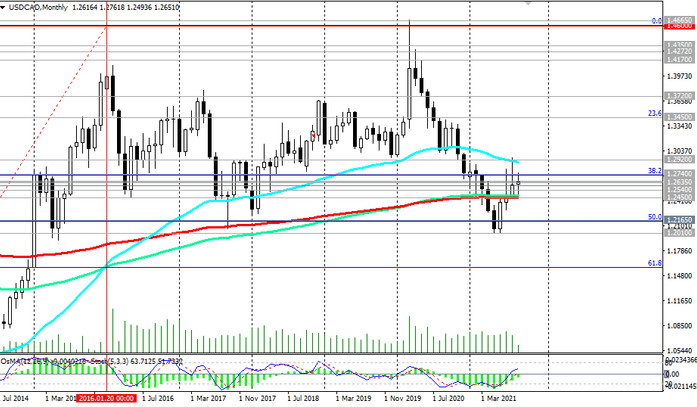
In case of a breakdown of the resistance level 1.2660, further growth towards the key resistance level 1.2920 (ЕМА200 and the upper line of the descending channel on the weekly chart) is likely. A return into the zone above this resistance level would mean a recovery in the long-term bullish trend in USD / CAD.
In an alternative scenario, the price will break through the support level 1.2540 (ЕМА144 on the daily chart) and resume the downward trend with targets at 15-year lows and 1.2000, near which USD / CAD was in early June.
The first signal for the implementation of this scenario will be the breakdown of the important short-term support level 1.2635, and the breakdown of the support level 1.2450 (ЕМА200 on the monthly chart) will confirm the return of USD / CAD into the long-term downtrend that formed at the end of March 2020.
Support levels: 1.2635, 1.2600, 1.2540, 1.2500, 1.2450
Resistance levels: 1.2660, 1.2740, 1.2825, 1.2920
Trading scenarios
Sell Stop 1.2630. Stop-Loss 1.2680. Take-Profit 1.2600, 1.2540, 1.2475, 1.2450, 1.2330, 1.2200, 1.2165, 1.2100
Buy Stop 1.2680. Stop-Loss 1.2630. Take-Profit 1.2700, 1.2740, 1.2825, 1.2920