
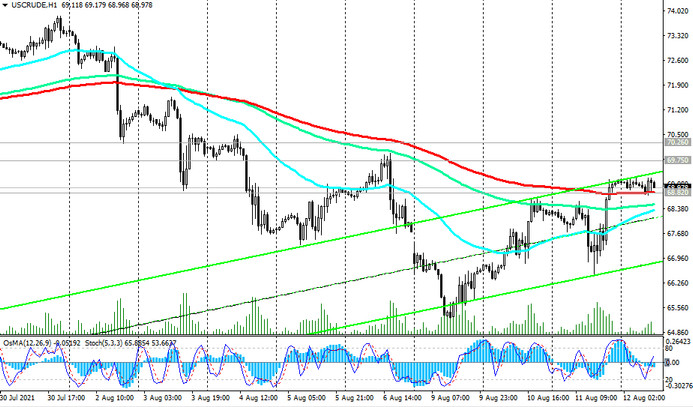
It seems that the dynamics of the price of WTI crude oil again becomes negative.
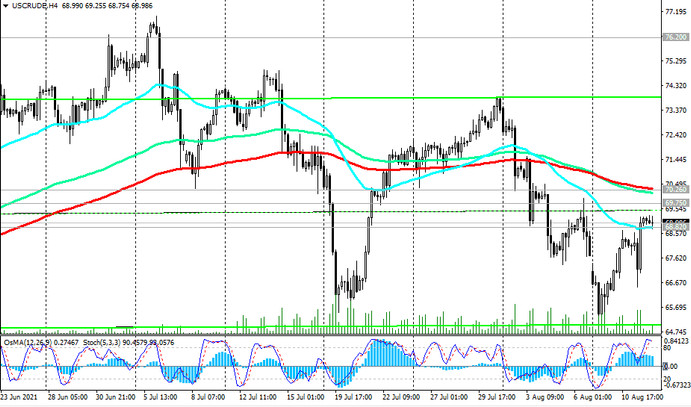
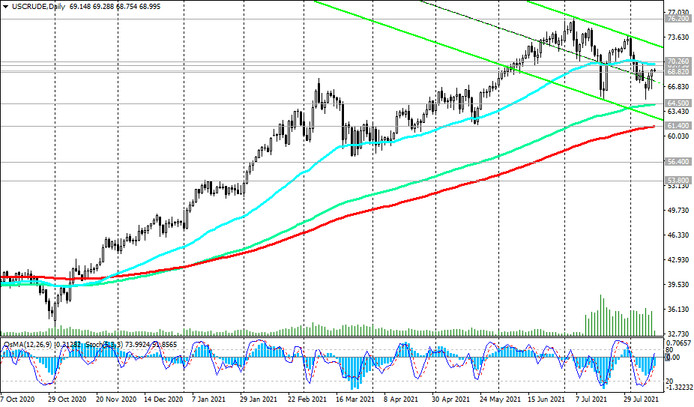
At least the price is below the important resistance levels 70.26 (EMA200 on the 4-hour chart), 69.75 (EMA50 on the daily chart) and is moving within the descending channel on the daily chart.
Break of short-term support level 68.82 (ЕМА200 on 1-hour chart) will be another confirmation signal in favor of resuming short positions with targets at key long-term support levels 64.50 (ЕМА144 on the daily chart), 61.40 (ЕМА200 on the daily chart).
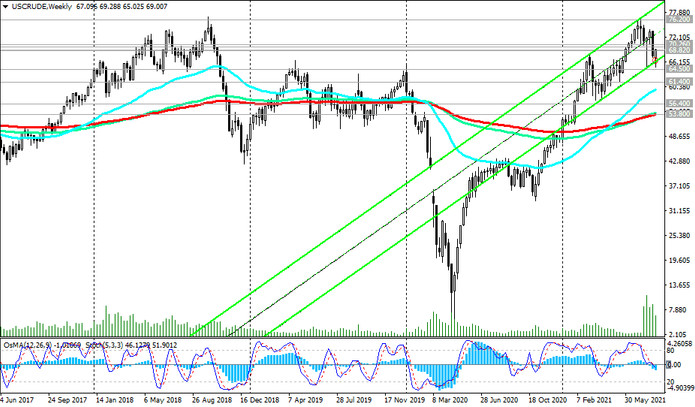
Break of the support level 53.80 (ЕМА200 on the weekly chart) will bring WTI oil back to the bear market.
In an alternative scenario, the breakdown of the 69.75, 70.26 resistance levels will become a signal to open long positions with targets at the local resistance level 73.80. A breakdown of the local resistance level 76.20 (July and almost 3 years highs) will provoke further price growth. However, some of the important fundamentals described above will keep more aggressive buying and prices from rising above the 71.00 level.
Support levels: 68.82, 64.50, 61.40, 60.00, 56.40, 53.80
Resistance levels: 69.75, 70.26, 71.00, 73.80, 74.00, 75.00, 76.20
Trading recommendations
Sell Stop 68.50. Stop-Loss 69.60. Take-Profit 67.00, 66.00, 64.50, 61.40, 60.00, 56.40, 53.80
Buy Stop 69.60. Stop-Loss 68.50. Take-Profit 69.75, 70.26, 71.00, 73.80, 74.00, 75.00, 76.20


